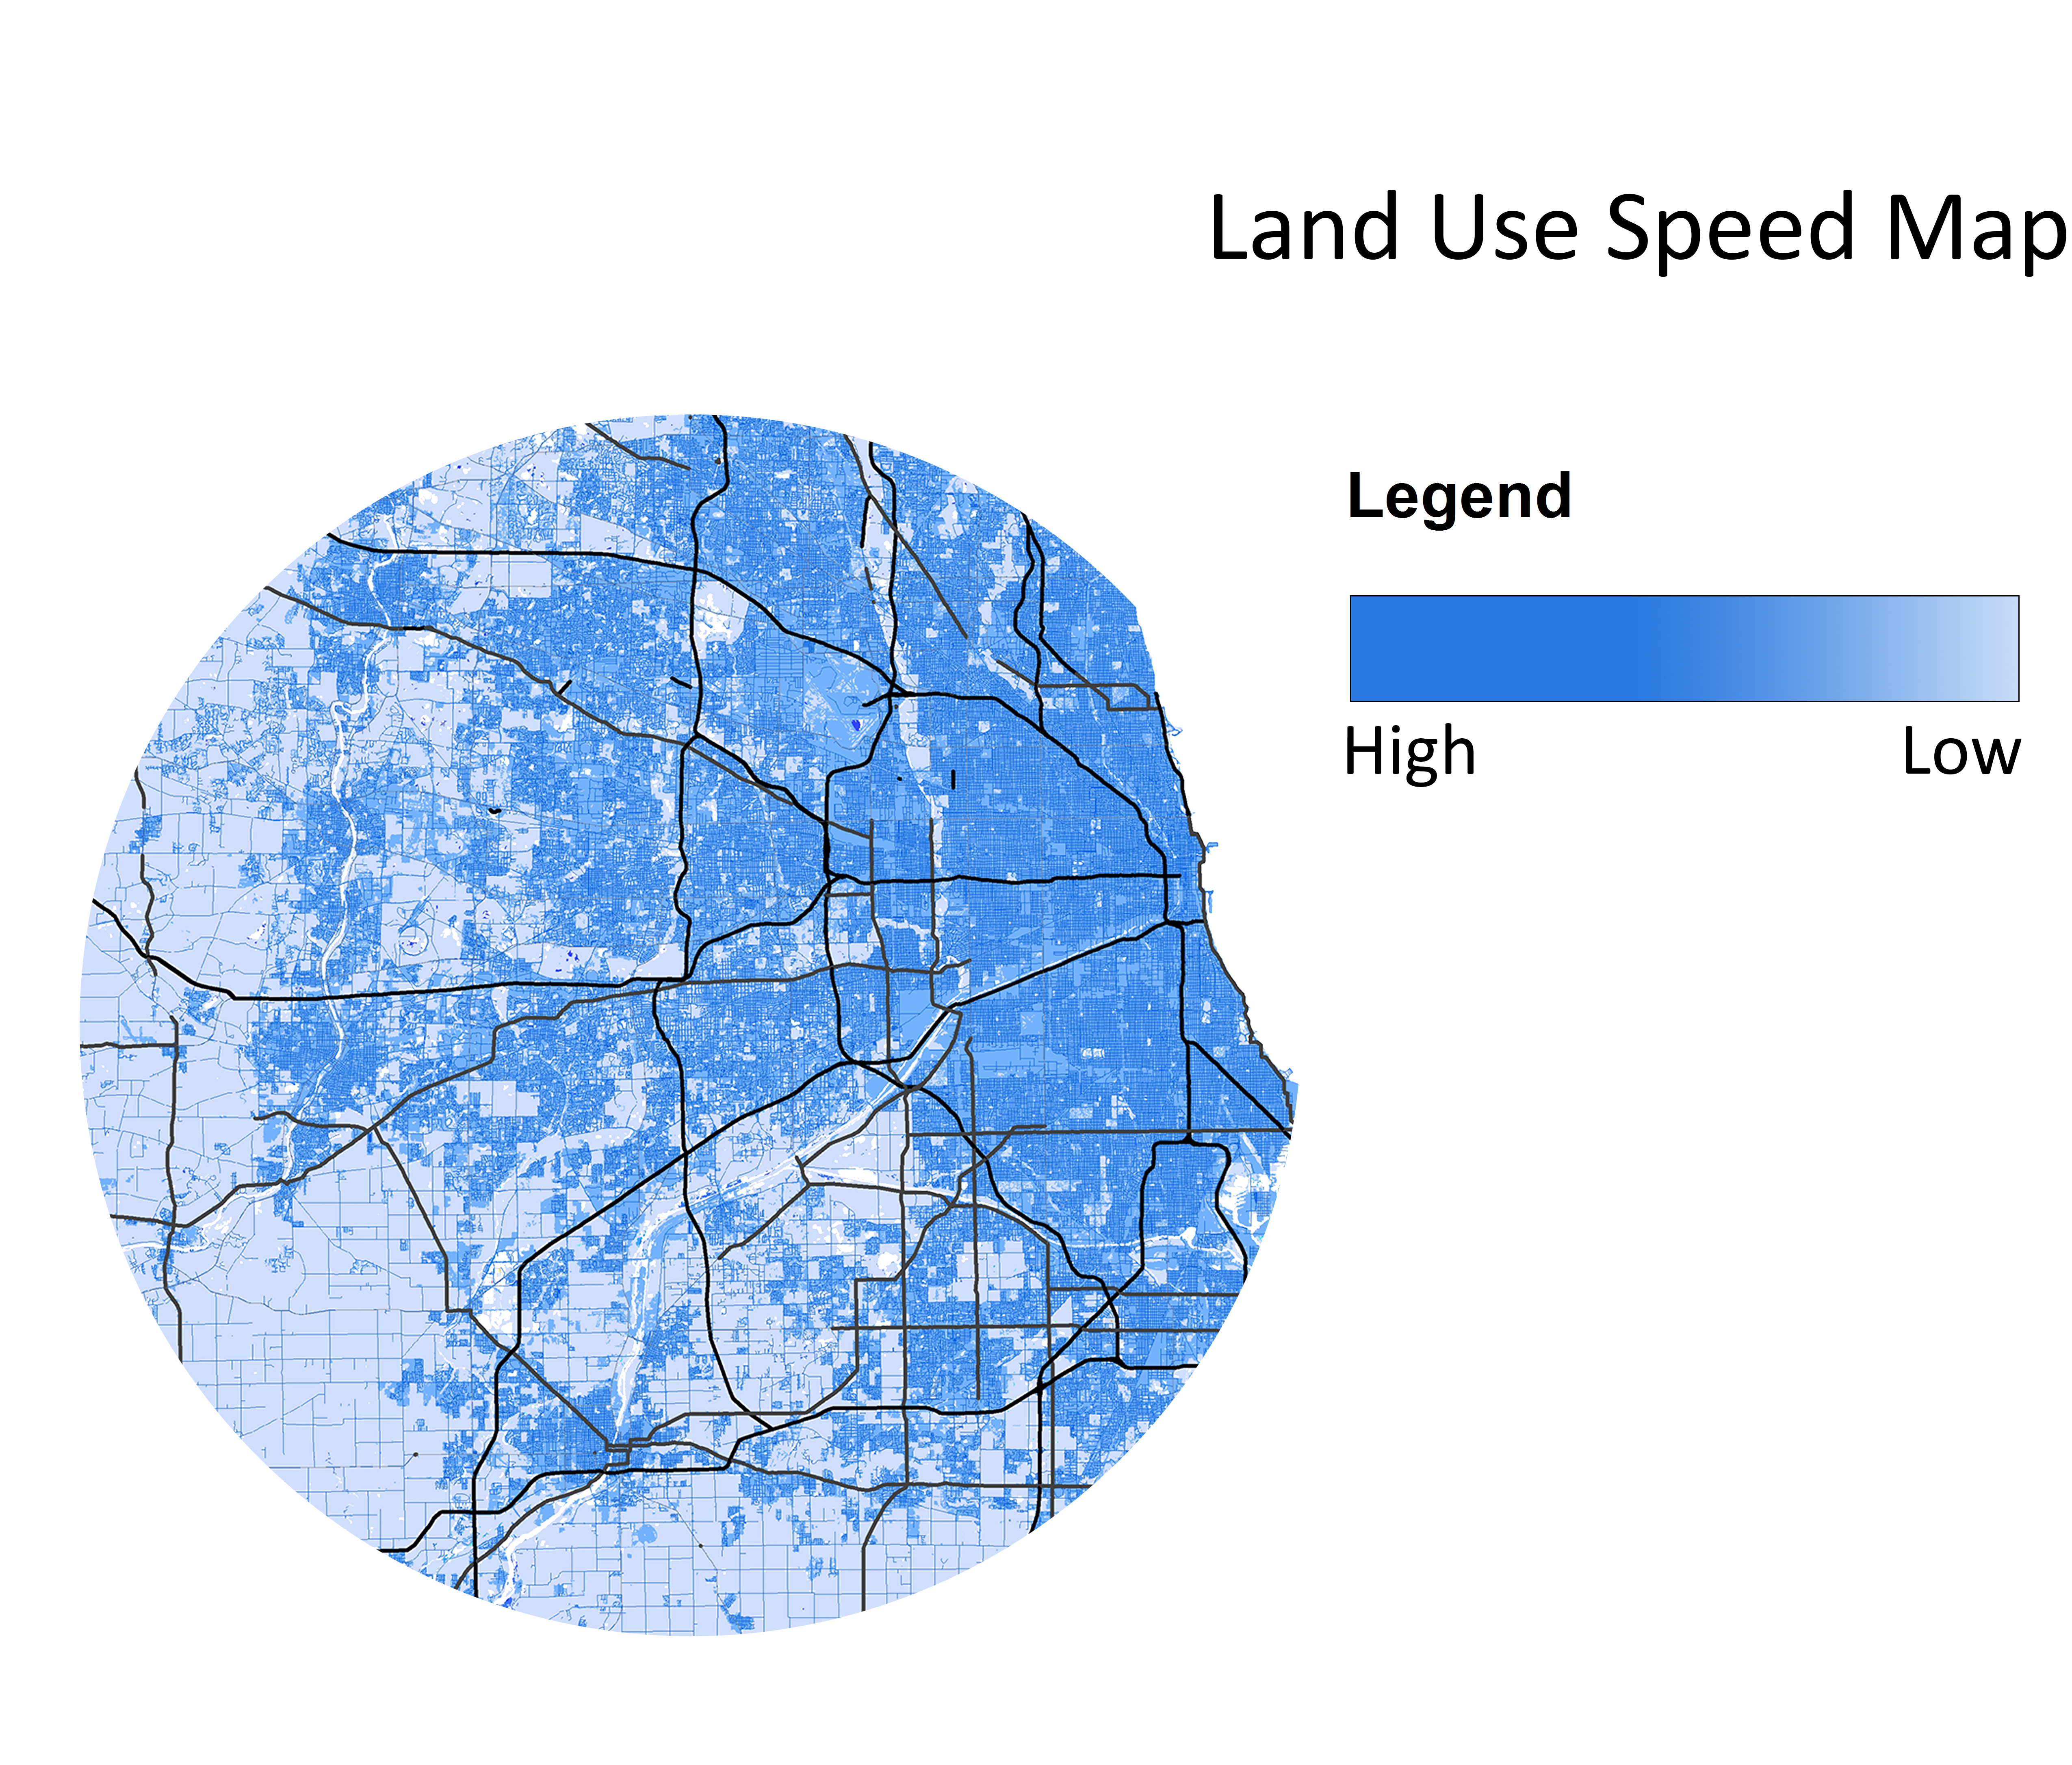
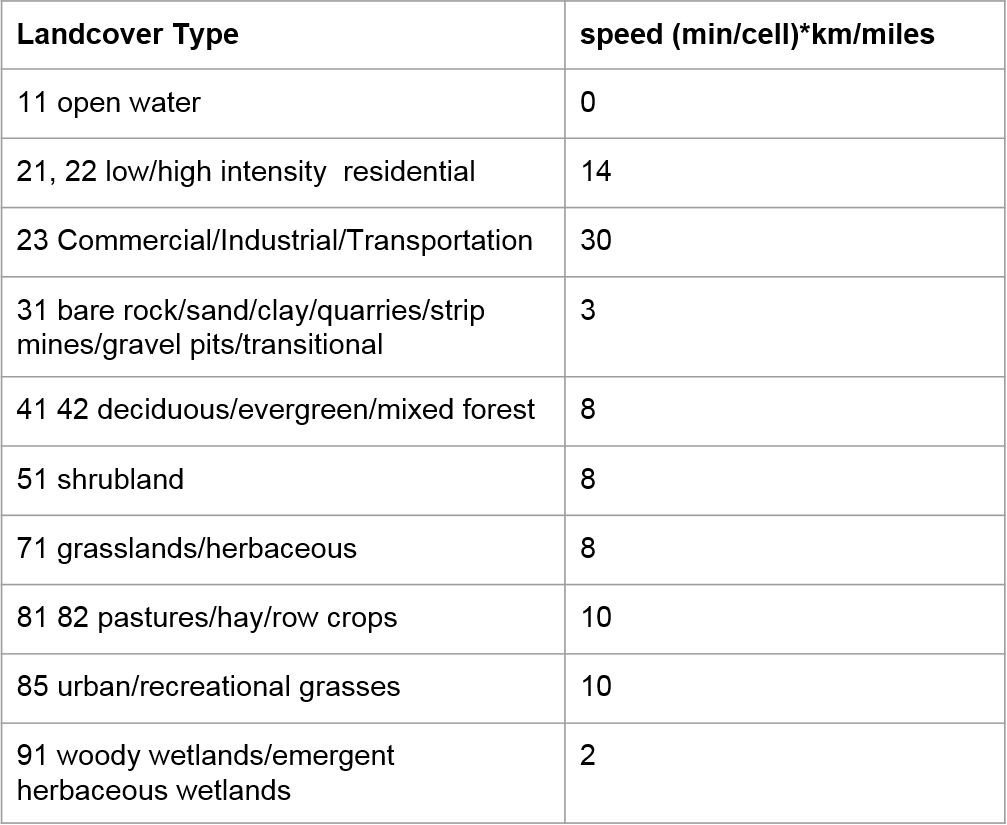
Land Use Map TO Land Use Speed Map: Speed Chart
Click to log in. If you are new user, use email to register an account.
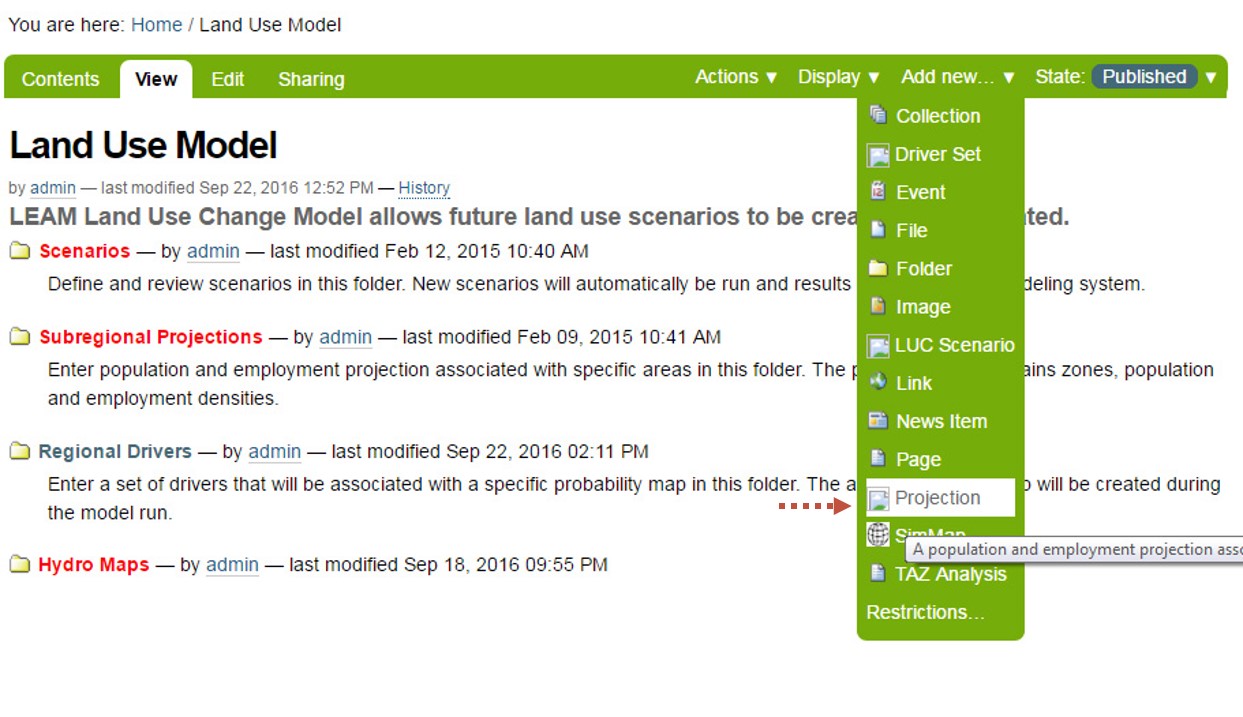
Logging in, click "START NOW" or "LAND USE MODEL" to start building a model. Links to every step of the model are available in this tutorial.
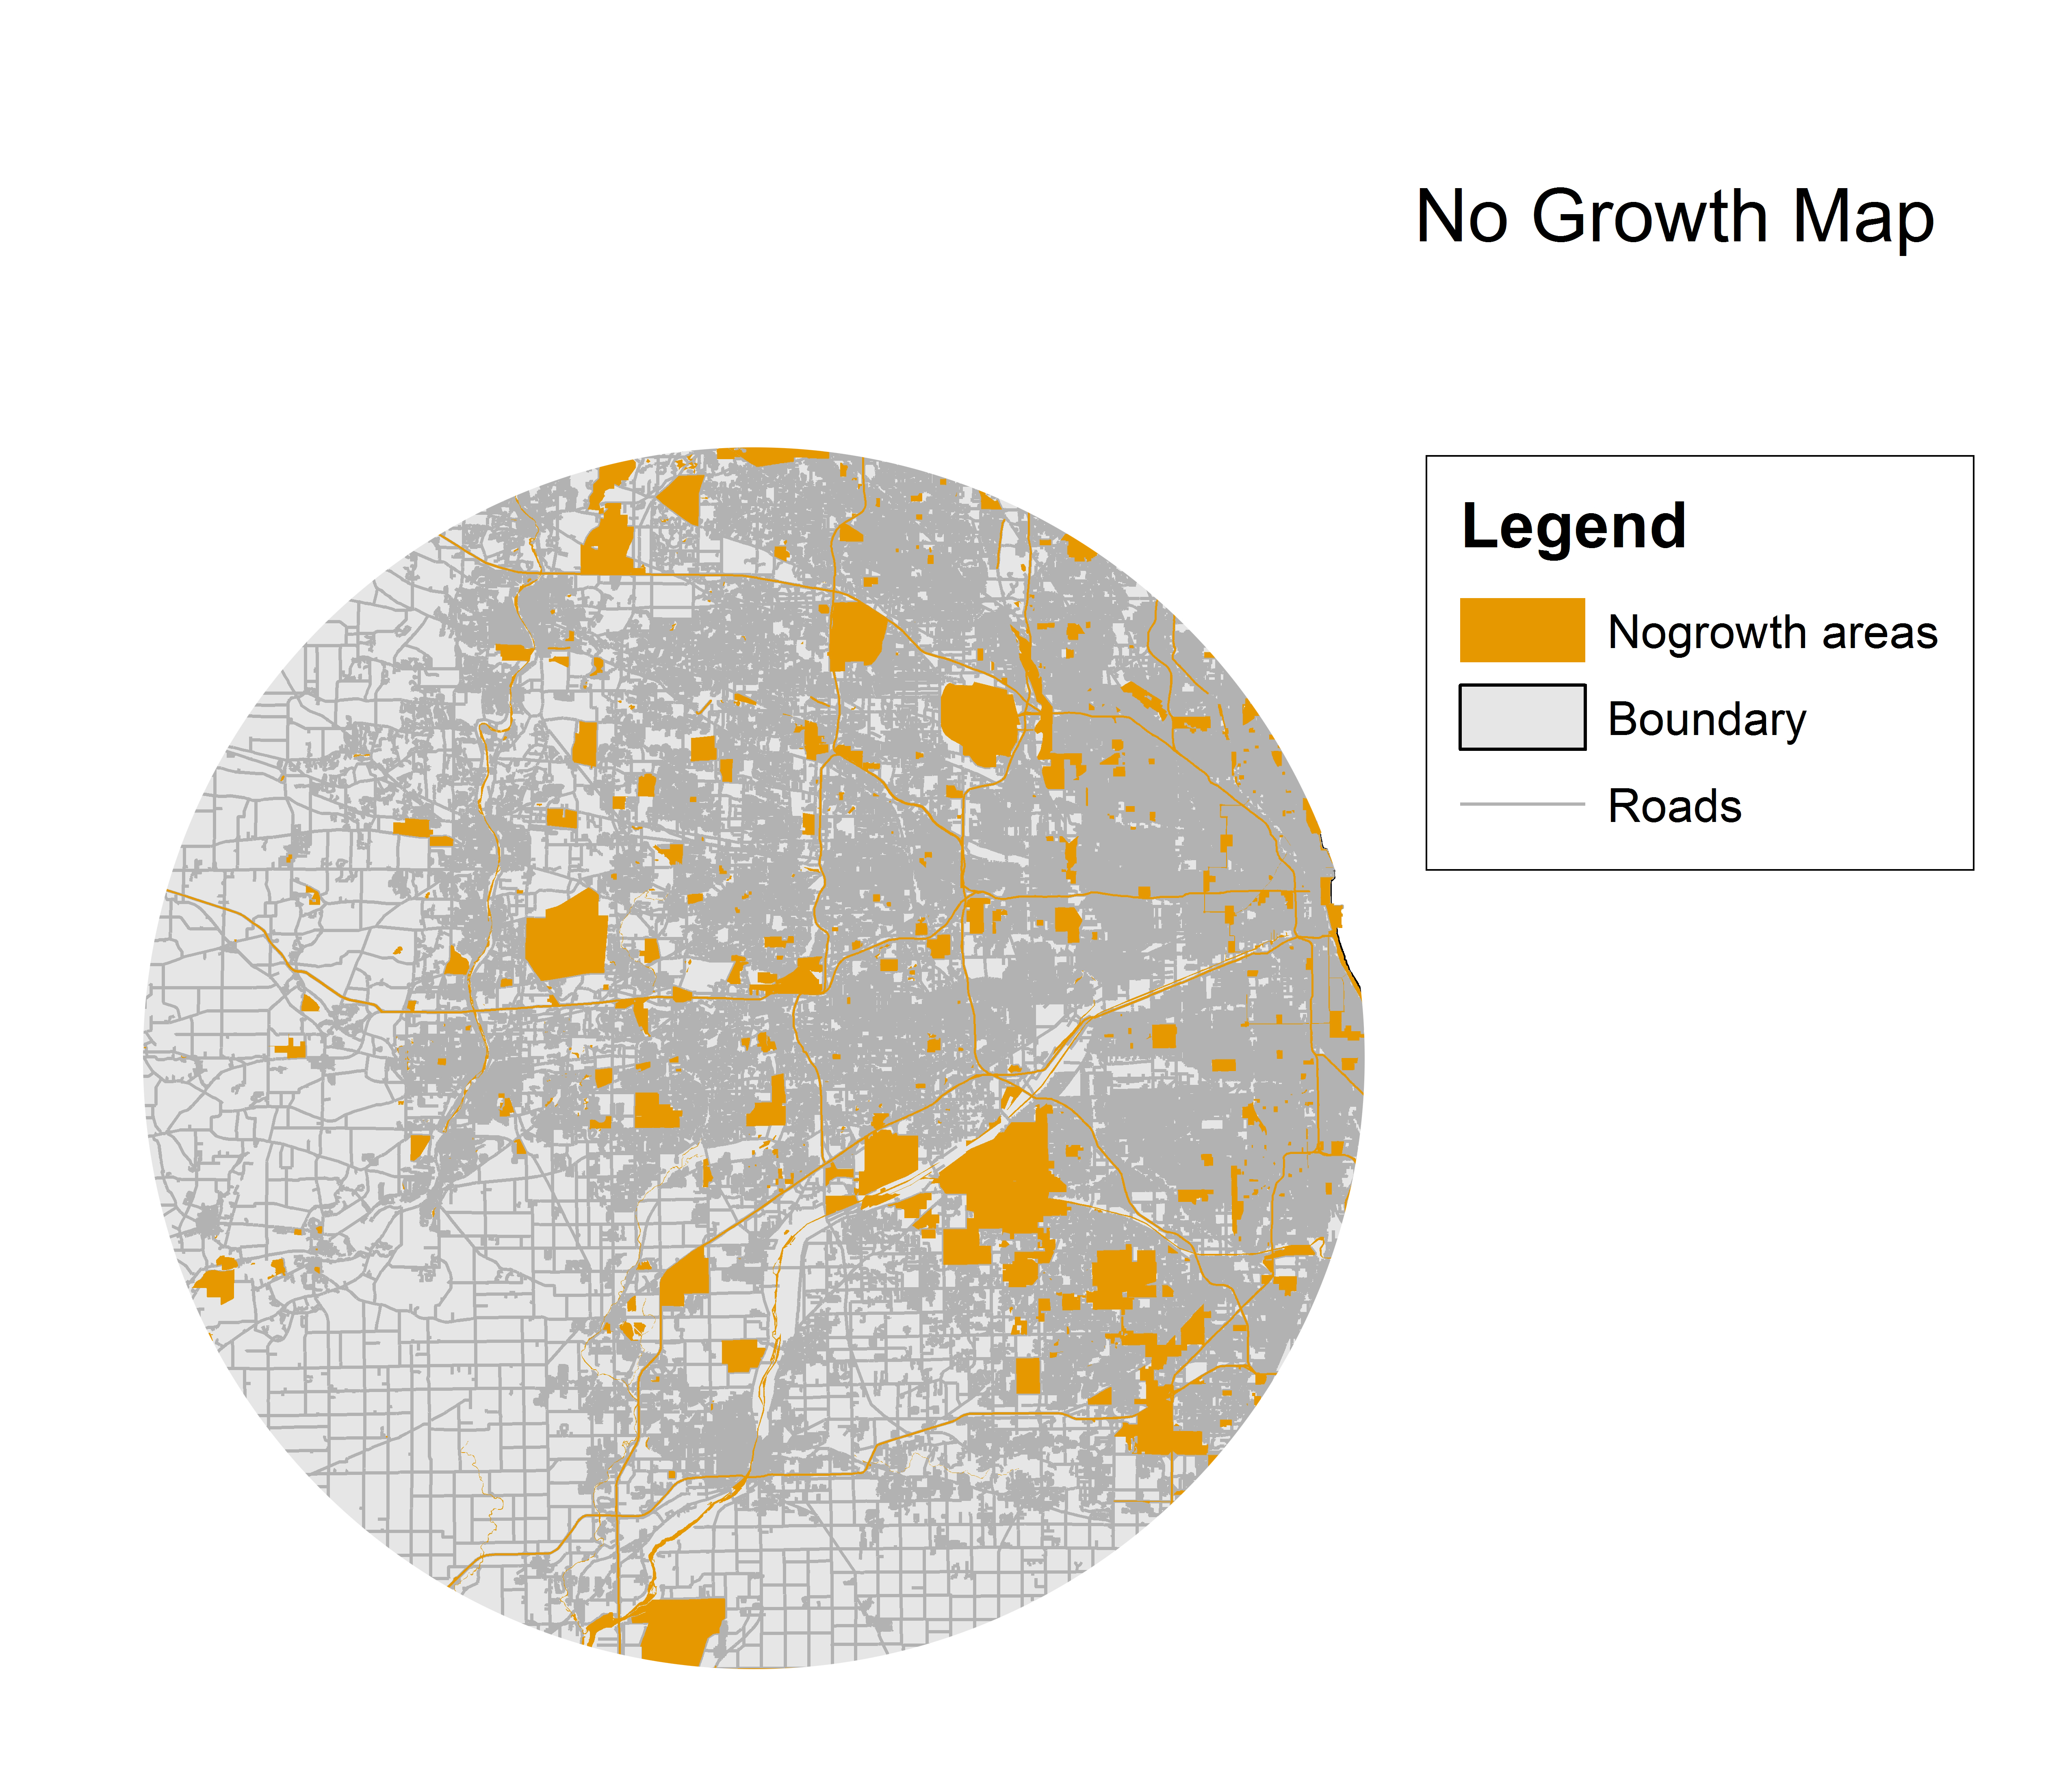
Description: The "No growth" map is a collection of areas where no development is expected to occur.
Typical land uses that are considered "no growth": flood zones, historic preservation districts, green infrastructure
Recommended tool to create map: ArcGIS
Requirements: Two files are needed for uploading the "no growth" map; a map file and a zip file.
To make zip file, use ArcGIS to make a shapfile for the "no growth" map. Compress the following 8 files that comprise the shapefile: .cpg, .dbf, .prj, .sbn, .shp.(2), .sbx, .shx
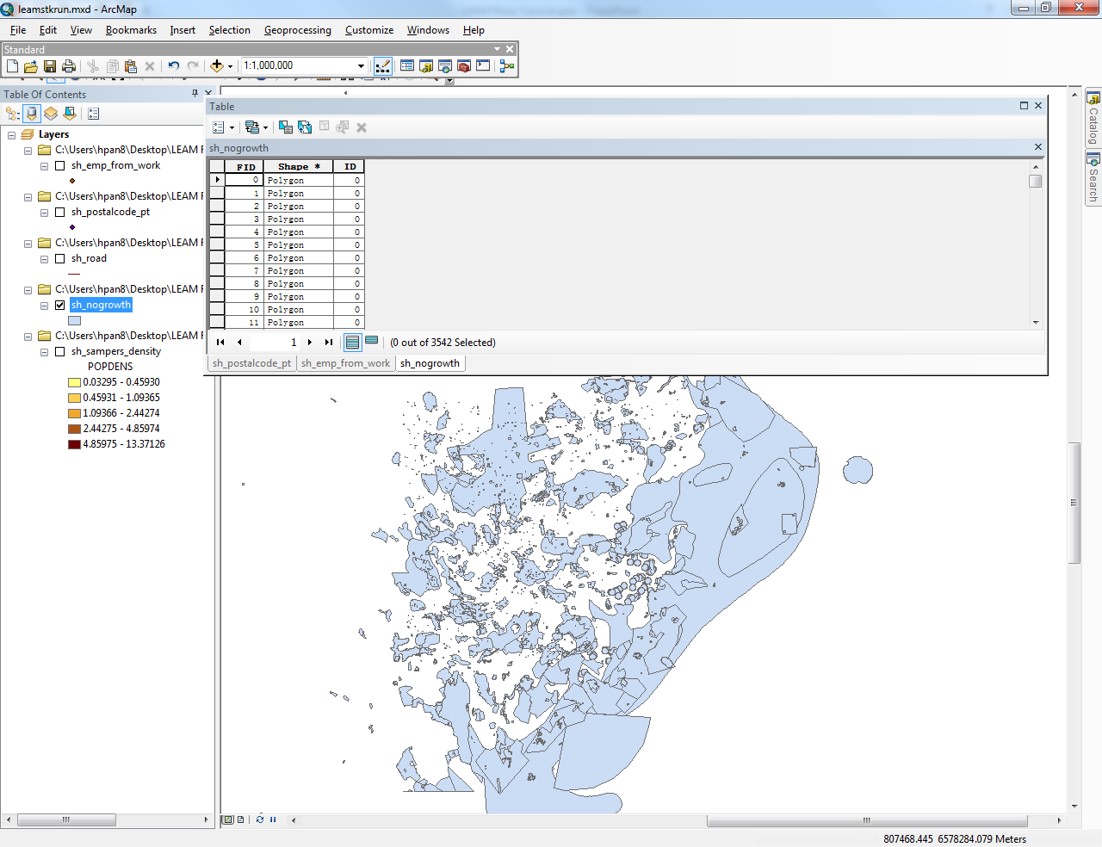
"No growth" areas are presented as polygons in GIS.
The following is an example "no growth" map created in ArcGIS.
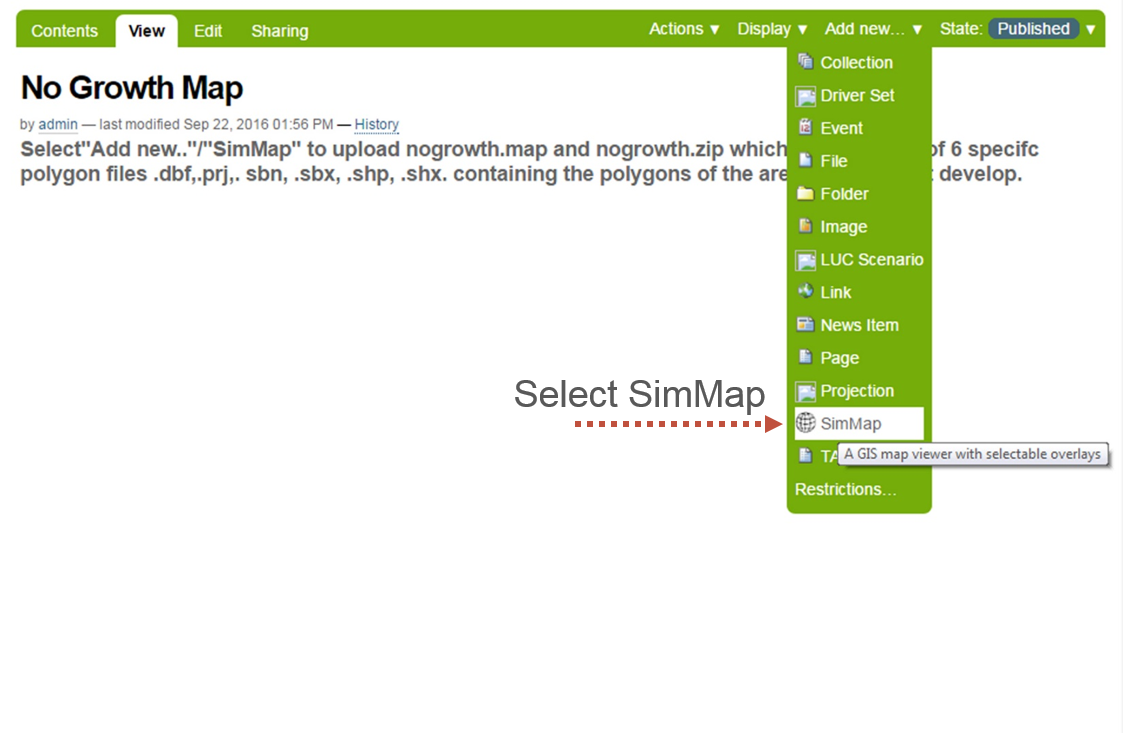
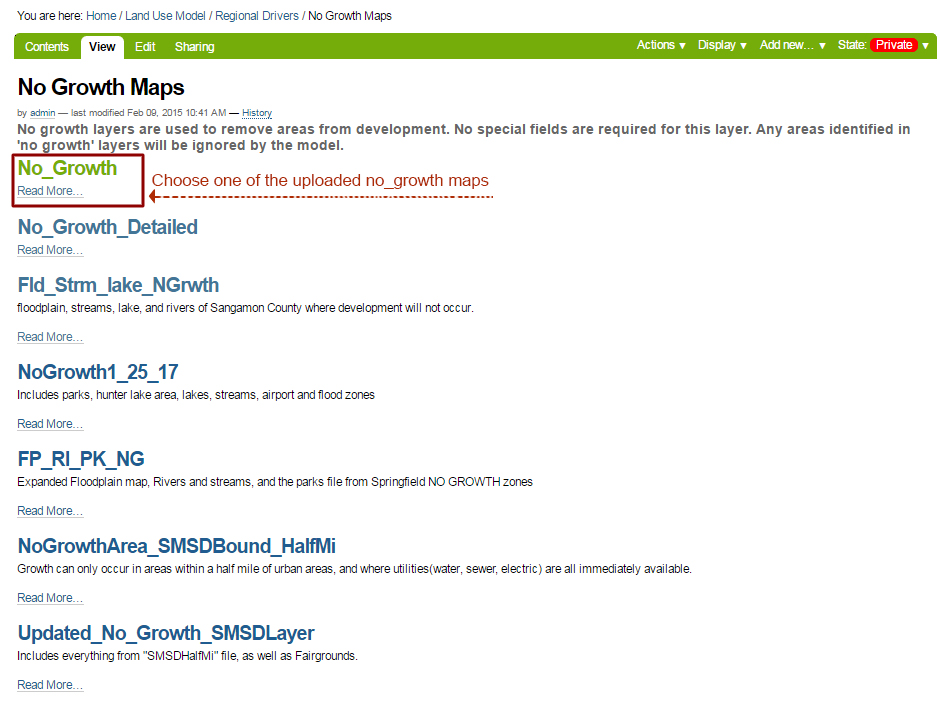
Click the button below to enter the Plone site and upload a "No Growth" map. Then, click "Add new.."/"SimMap" to upload.
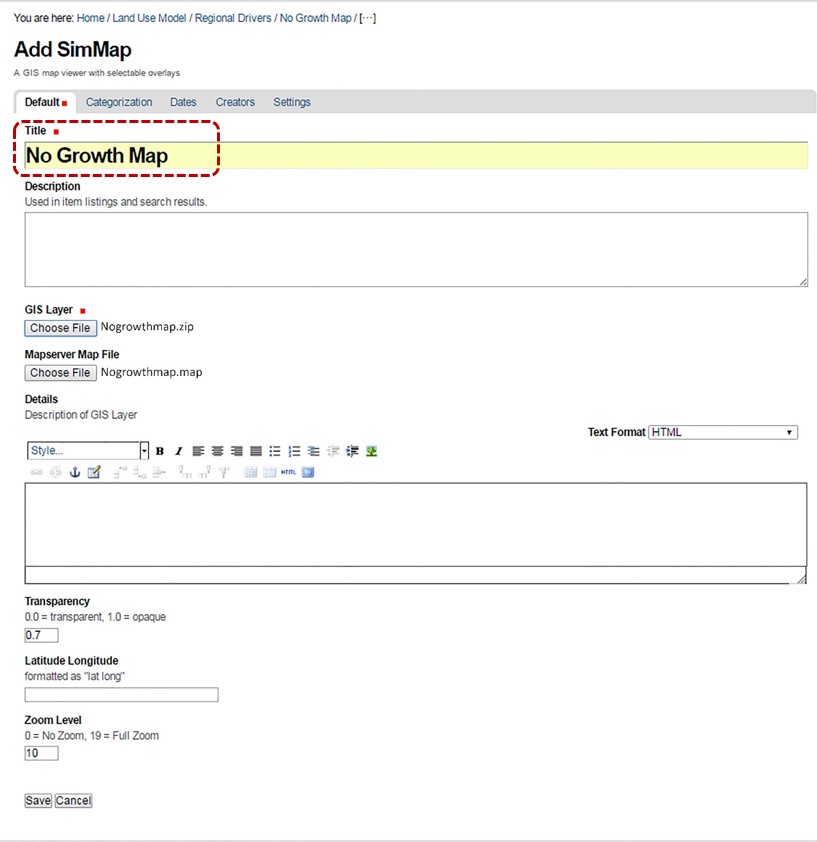
Provide a descriptive title for your map that will differentiate it from other maps. (The name should only contain letters, numbers, and underscores).
Click "Choose file" to upload the zip file and mapfile.
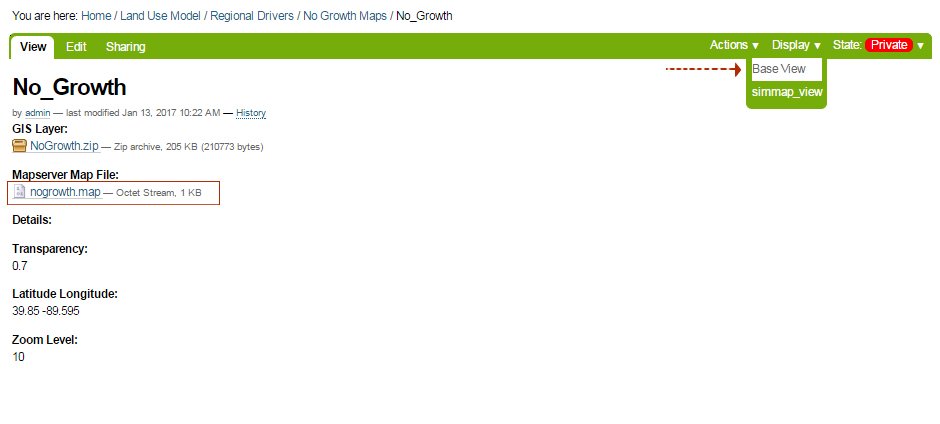
LEAM will provide the mapfile. It can be obtained from previously uploaded "no growth" maps. This file contains location information to accurately locate the map in the Google API.
To obtain the mapfile from previously uploaded maps, change the display to Base View. Click the mapfile to download.
Description: Population centers represent the community centers.
Source: Using locally collected data is best but Census data can also be used (Often not accurate, especially for rural areas)
Recommended tool: ArcGIS
Requirements: Two files are needed for population centers; a map file and a zip file.
Follow the method mentioned above to obtain map file.
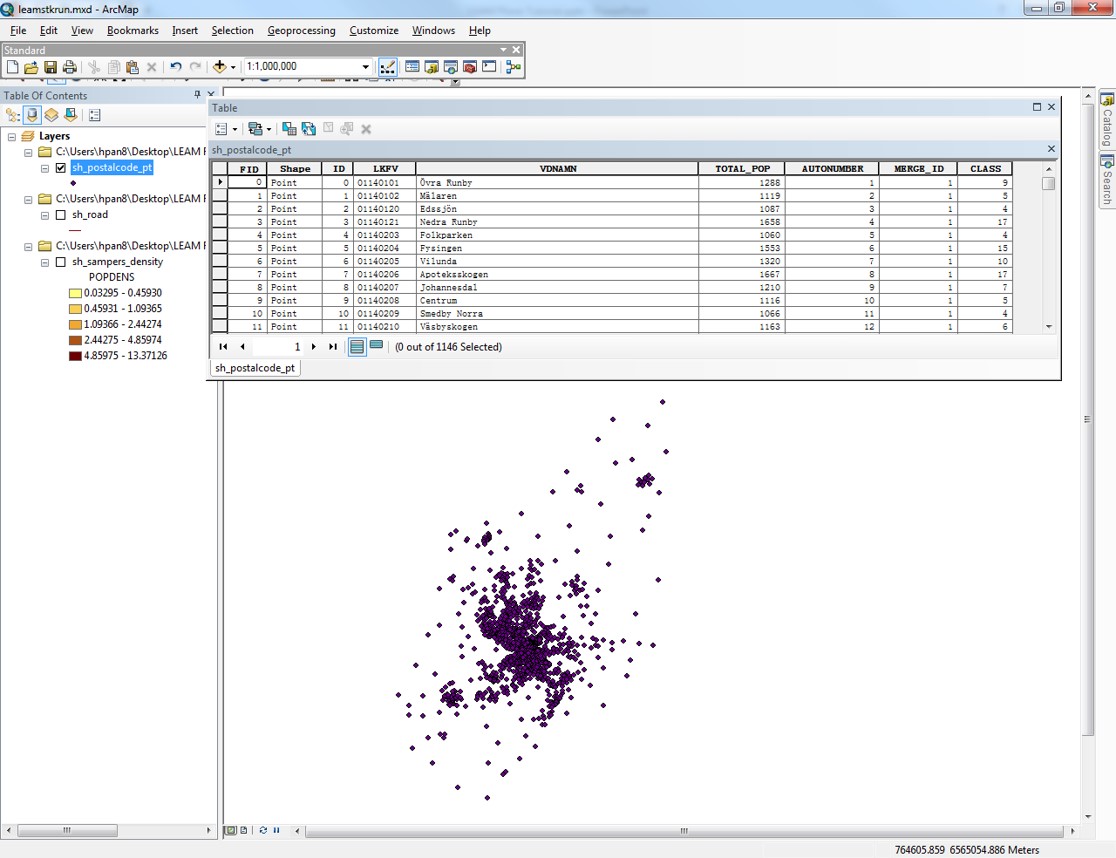
The same process used to make the "no growth" map can be used to make the population centers map and zip it for upload. Note that the "attribute table" of the map should include TWO FIELDS; "total_pop" AND "CLASS".
The "total_pop" values represent the total population of each population center (point data).
The "CLASS" values are the classification number representing population level of a center. You can design you own classification. For example, from lowest population level to highest, the number range from 1 to 5.
Then compress the 8 formats of files ─ .cpg, .dbf, .prj, .sbn, .shp.(2), .sbx, .shx ─ into a zip file.
The Following is a "population centers" map created in ArcGIS.
Click the button below to upload your map in Plone. When in Plone, click "Add new.."/"SimMap" to upload.
Follow the same procedures as the "no growth" map to upload (Note: Title should only contain letters, numbers and underscores).
Description: Employment centers often represent aggregate employment data given a particular geographic area. For both Employment and Population Center data, disaggregated data tends to provide better results.
Source: The local planning documents or Census data. Note that Census data is often very aggregate resulting in few employment center points. Using locally created data is often best.
Recommended tool: ArcGIS
Requirements: Two files are needed for employment centers; a map file and a zip file.
Follow the method mentioned above to obtain map file.
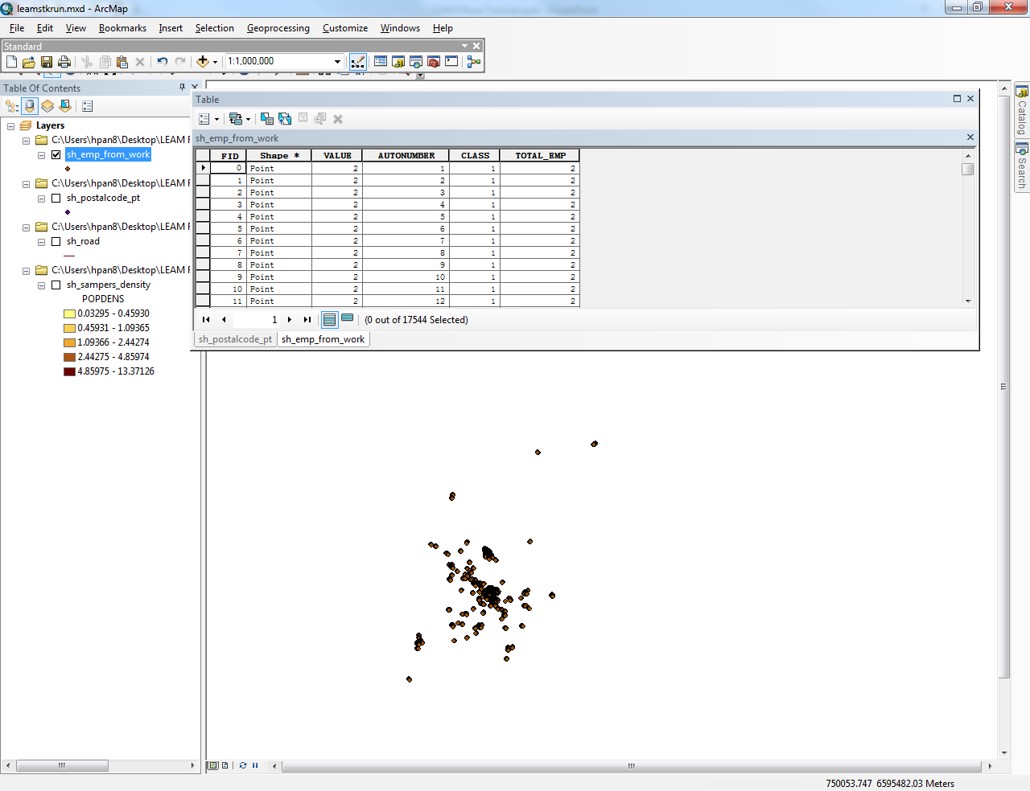
To make the zip file, use the same process mentioned previously but note that the ArcGIS "attribute table" needs to include TWO DATA FIELDS; "total_emp" AND "CLASS".
The "total_emp" values are the total number of employed persons for each employment center.
The "CLASS" values are the classification number representing employment level of a center.
Then compress the following 8 files ─ .cpg, .dbf, .prj, .sbn, .shp.(2), .sbx, .shx ─ into a zip file.
The following is a "Employment centers" map created in ArcGIS.
Click the button below to upload employment centers. When in Plone, click "Add new.."/"SimMap" to upload.
Follow the same process described above to upload (Note: The title should only contain letters, numbers and underscores).
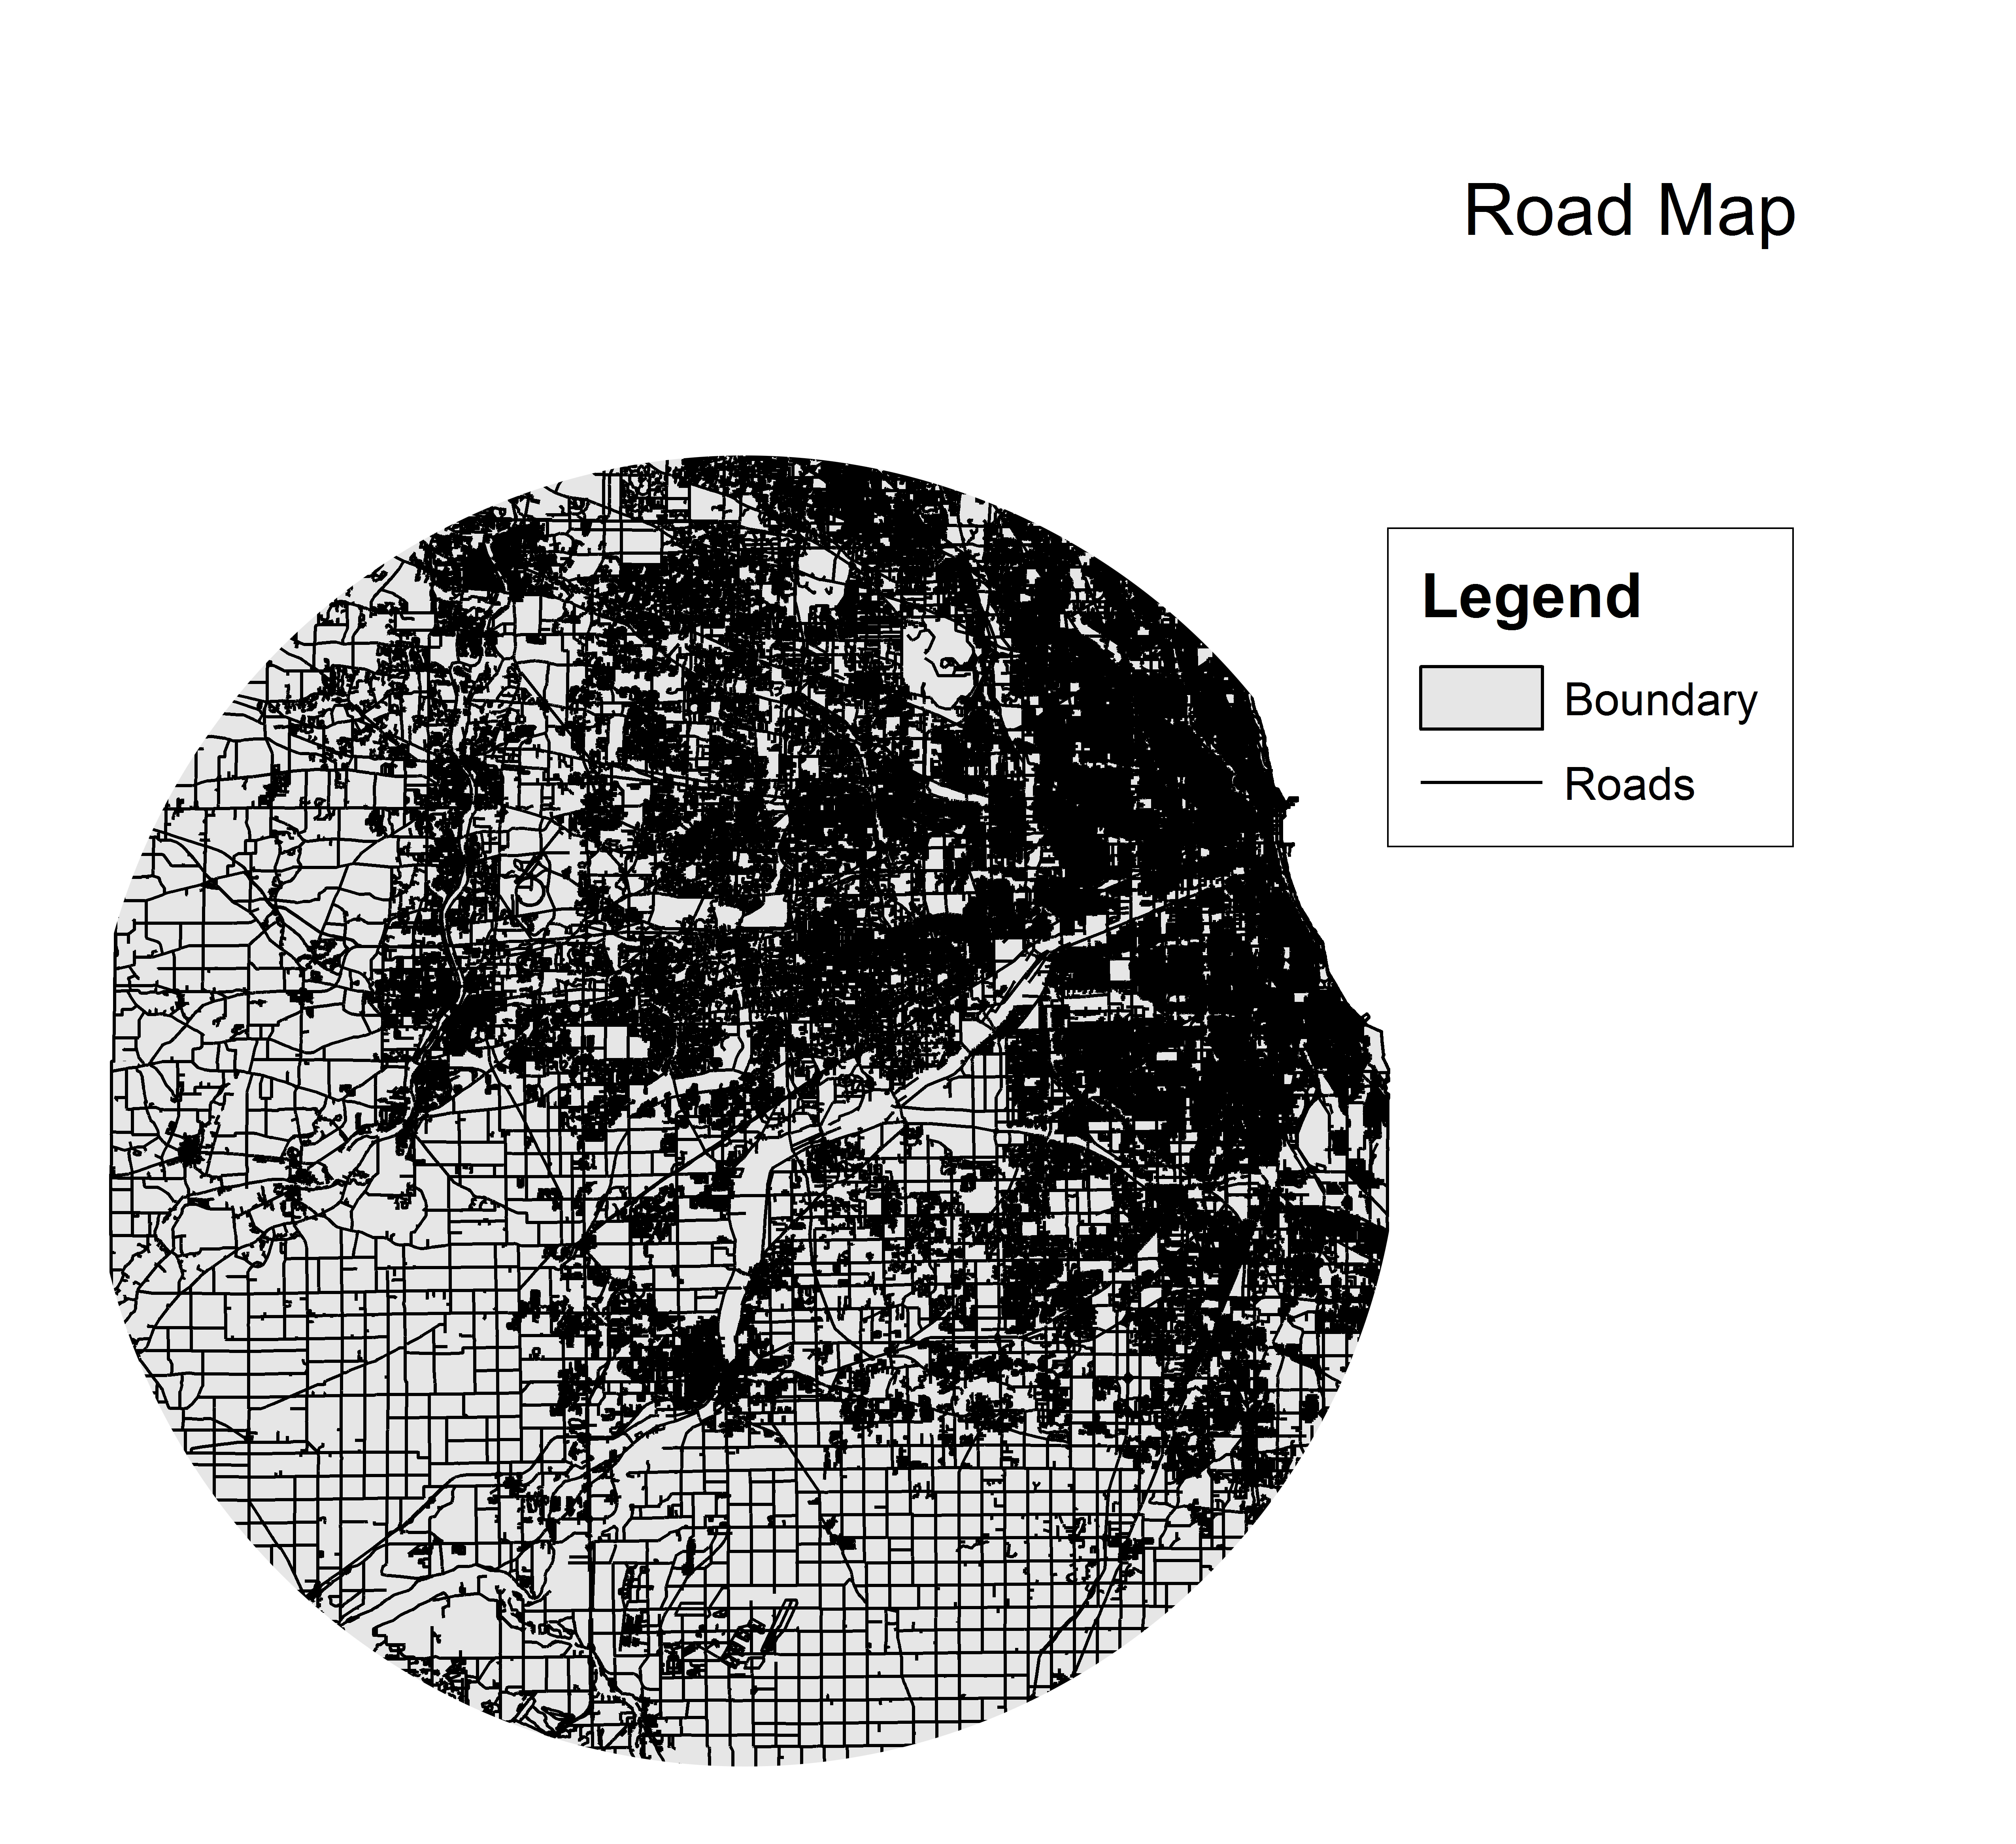
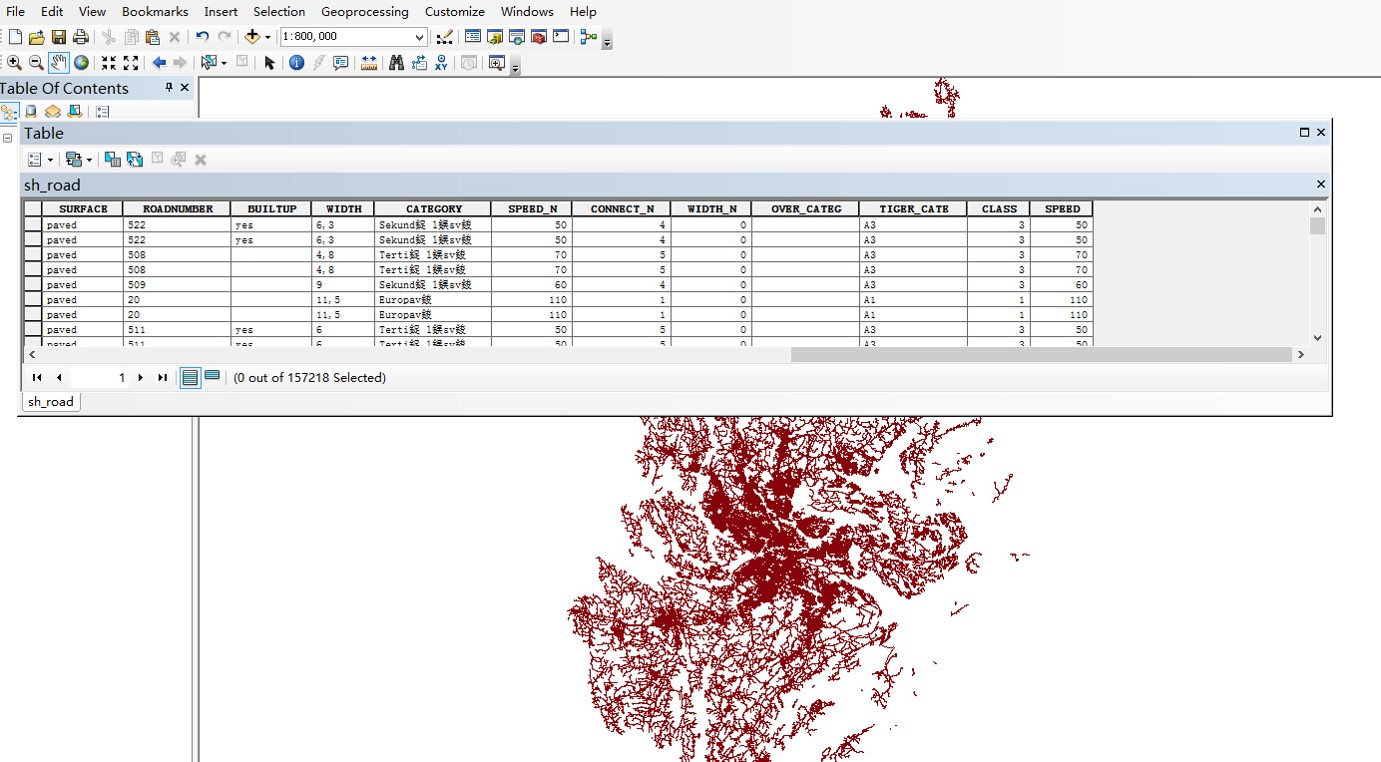
Description: The road network map represents the EXISTING road system. Subsequent road network maps can be created for scenario building using the same process.
Recommended tool: ArcGIS
Requirements: Two files are needed for road network map; a map file and a zip file.
Follow the method mentioned above to obtain map file.
To make the zip file, use ArcGIS to make a shapfile for road network system. The "attribute table" of the map should have TWO DATA FIELDS; "CLASS" AND "SPEED".
The "CLASS" is the road classifications. The 6 classfication numbers should be:
"1": Limited access highway.
"2": Federal highway.
"3": State highway.
"4": County/Neighborhood Road.
"5": new County/Neighborhood Road
"6": Ramp
The "SPEED" presents the average commuting speeds on the roads.
Click this button to upload the map in Plone. When in Plone click "Add new.."/"SimMap" to upload.
Follow the same steps to upload (Note: Title should only contain letters, numbers and underscores).
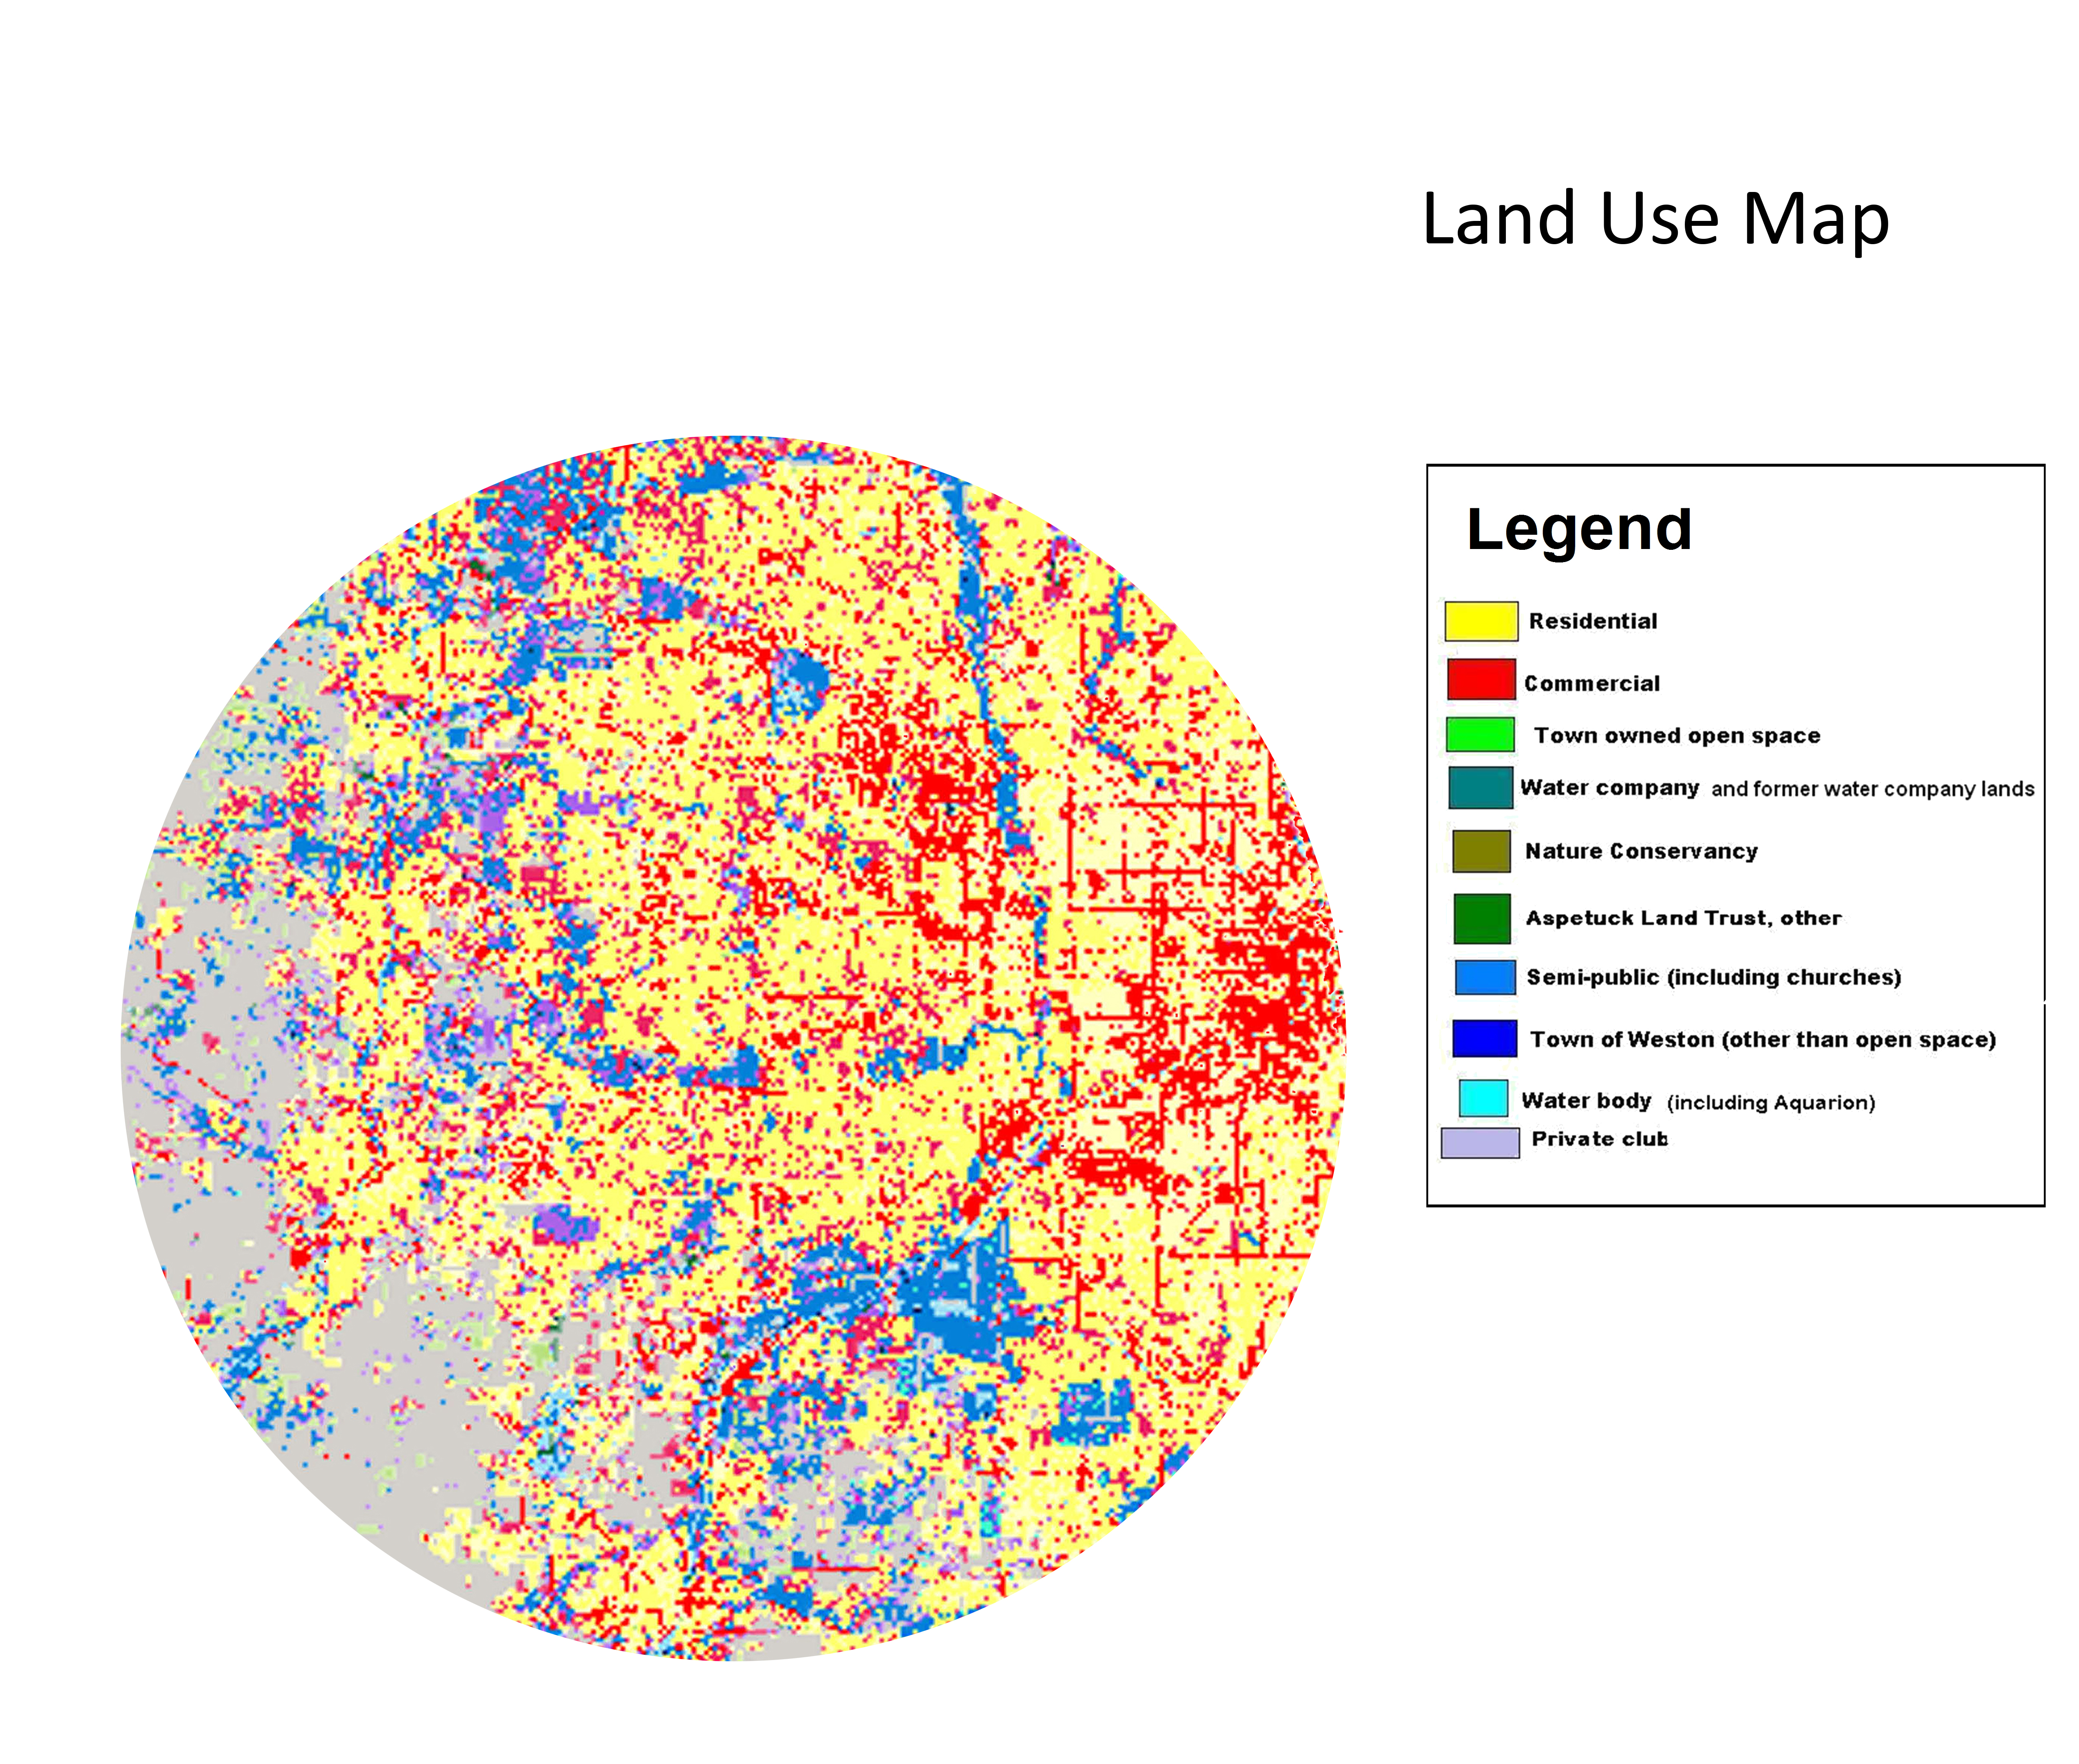
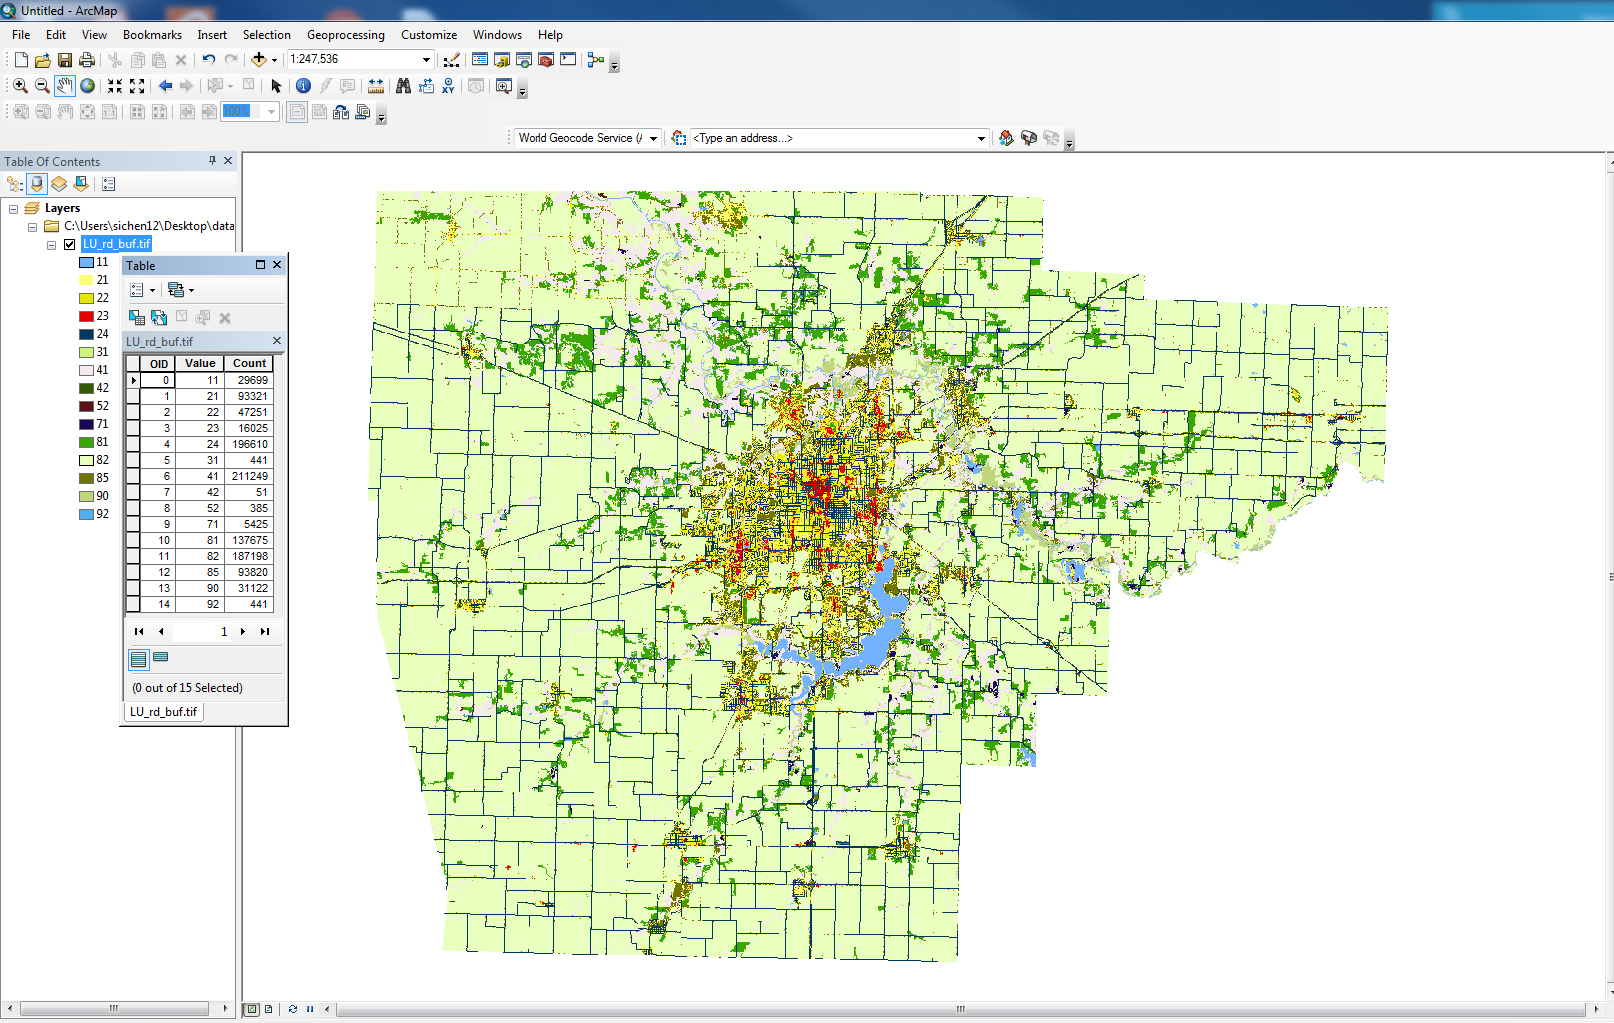
Description: The land use map represents the existing land use.
Recommended tool: ArcGIS
Sources: National Land Cover Database (NLCD)
Requirements: Two files are needed for the land use map; a map file and a zip file.
Follow the method mentioned above to obtain map file.
Use ArcGIS to make the raster map for existing land use. Note: the NLCD map often incorrectly classifies residential and commercial cells (particulary in rural areas). Each pixel has an assigned landuse type classification number. The LEAM Team suggests cleaning up the map as best as possible before uploading to the LEAM model.
Clip the map using sangamon county boundary.
Reclassify the original NLCD to the LEAM classification system as follows:
21 to 85 (open areas; light green on plone; not developable)
22 to 21 (residential areas, yellow on plone; not developable)
23 to 22 (mixed used areas, orange on plone; not developable)
24 to 23 (commercial areas, red on plone; not developable) 95 to 92 (merge wetland)
Compress the raster data to zip file.
Click this button to enter the uploading page, click "Add new.."/"SimMap" to upload.
Follow the same steps to upload (Note: Title should only contain letters, numbers and underscores).
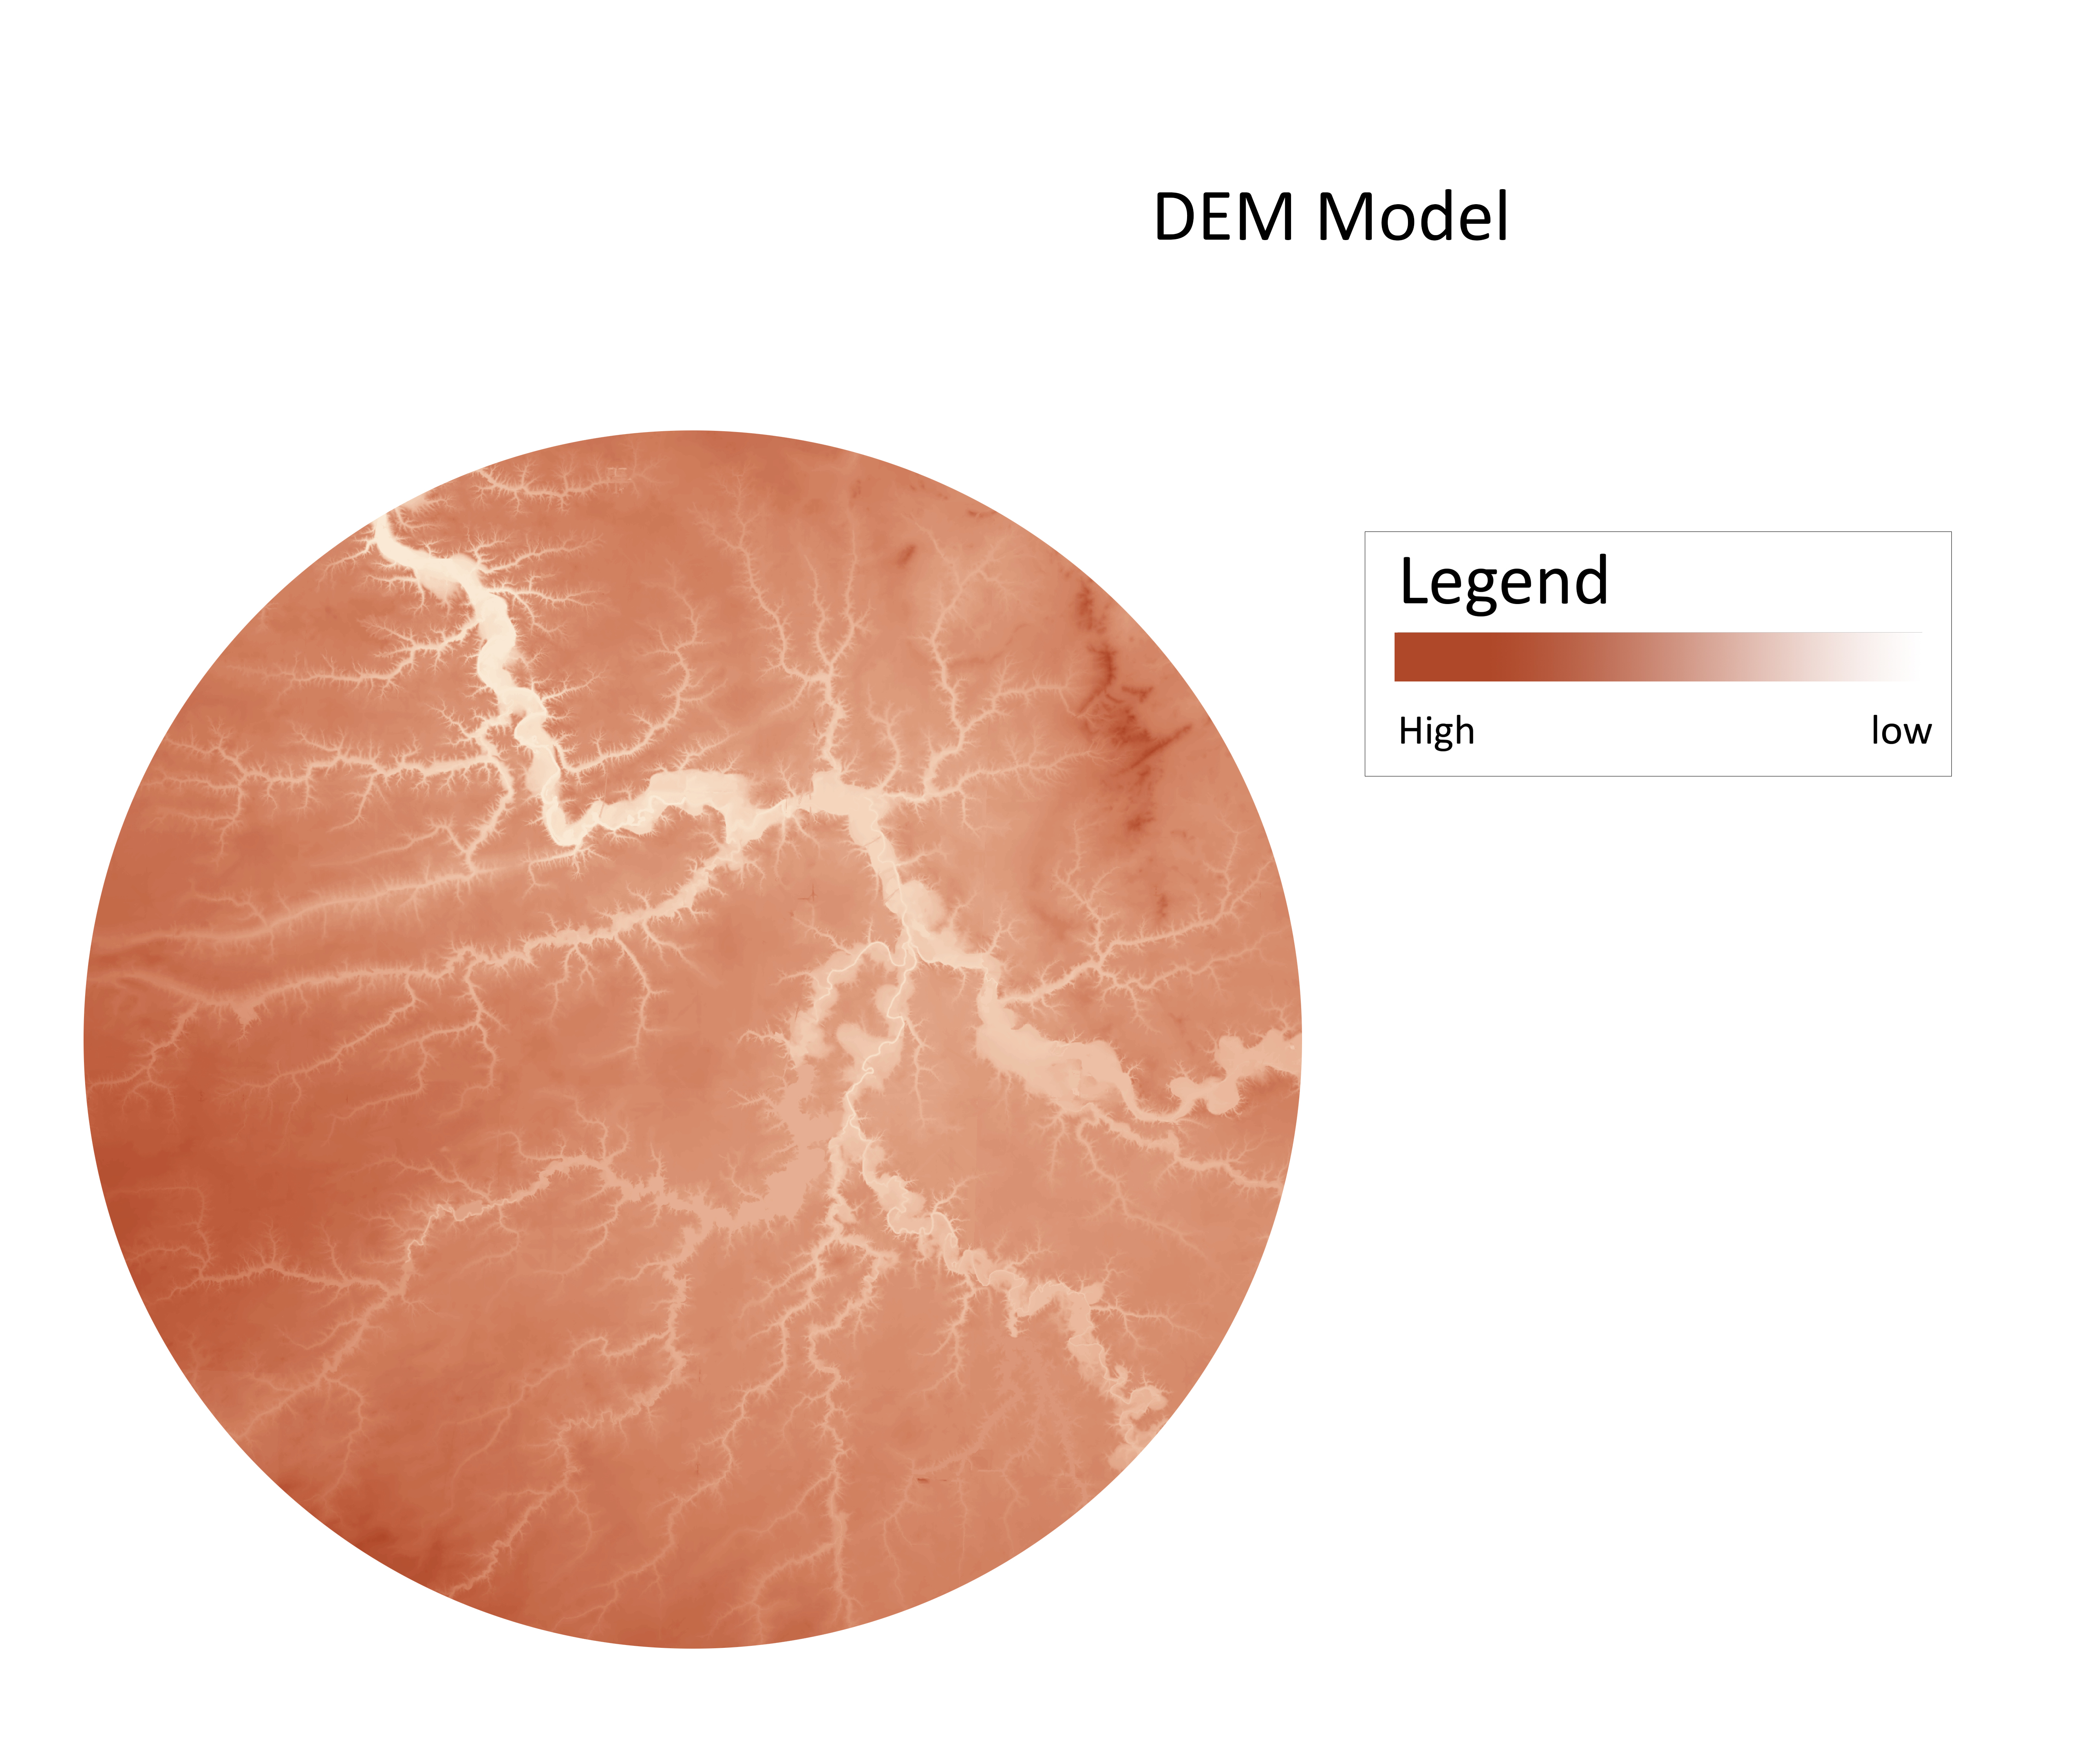
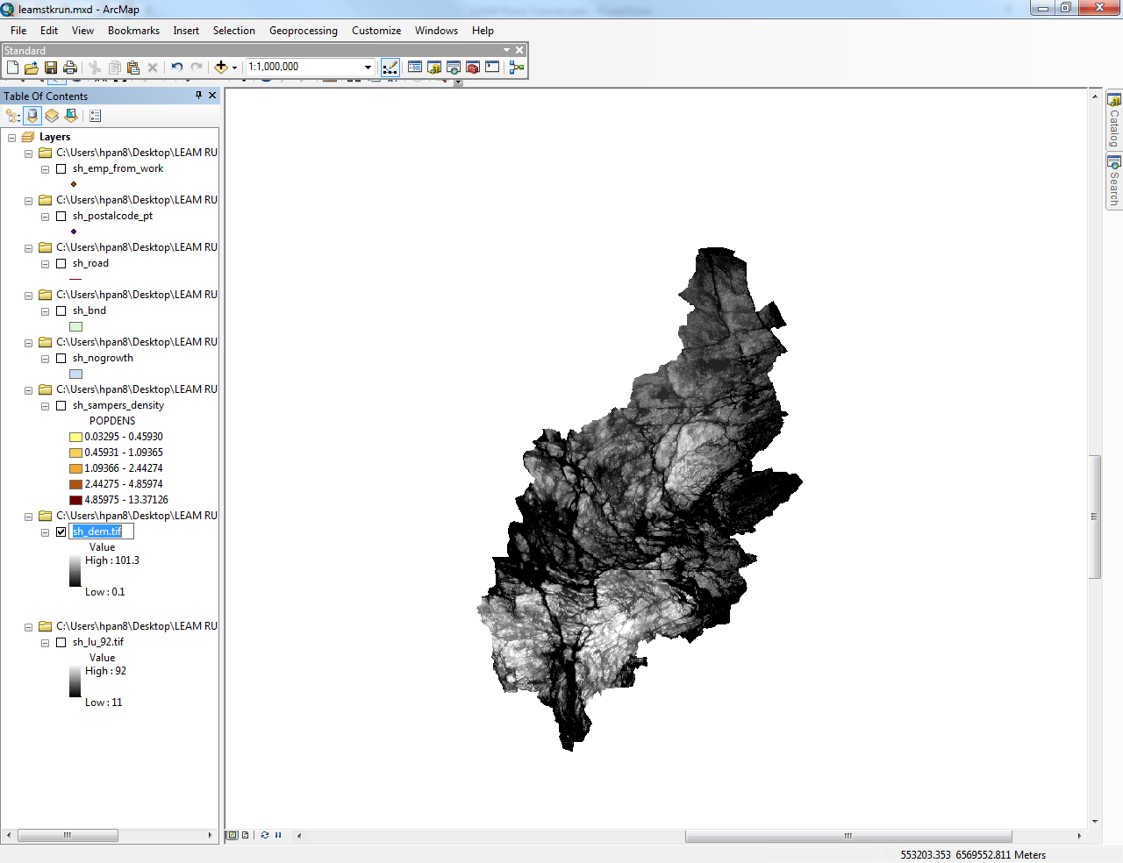
Description: The DEM model represents the topography for the study area.
Recommended tool: ArcGIS
Sources: Illinois State Geological Survey (ISGS) or U.S. Geological Survey (USGS)
Requirements: Two files are needed for the DEM model; a map file and a zip file.
Follow the method mentioned above to obtain the map file.
Use ArcGIS to convert the DEM to a raster map
Each pixel is assigned an elevation value.
Compress the raster data to zip file.
Click the button below to upload the map to Plone. When in Plone, click "Add new.."/"SimMap" to upload.
Follow the same steps to upload (Note: Title should only contain letters, numbers and underscores).
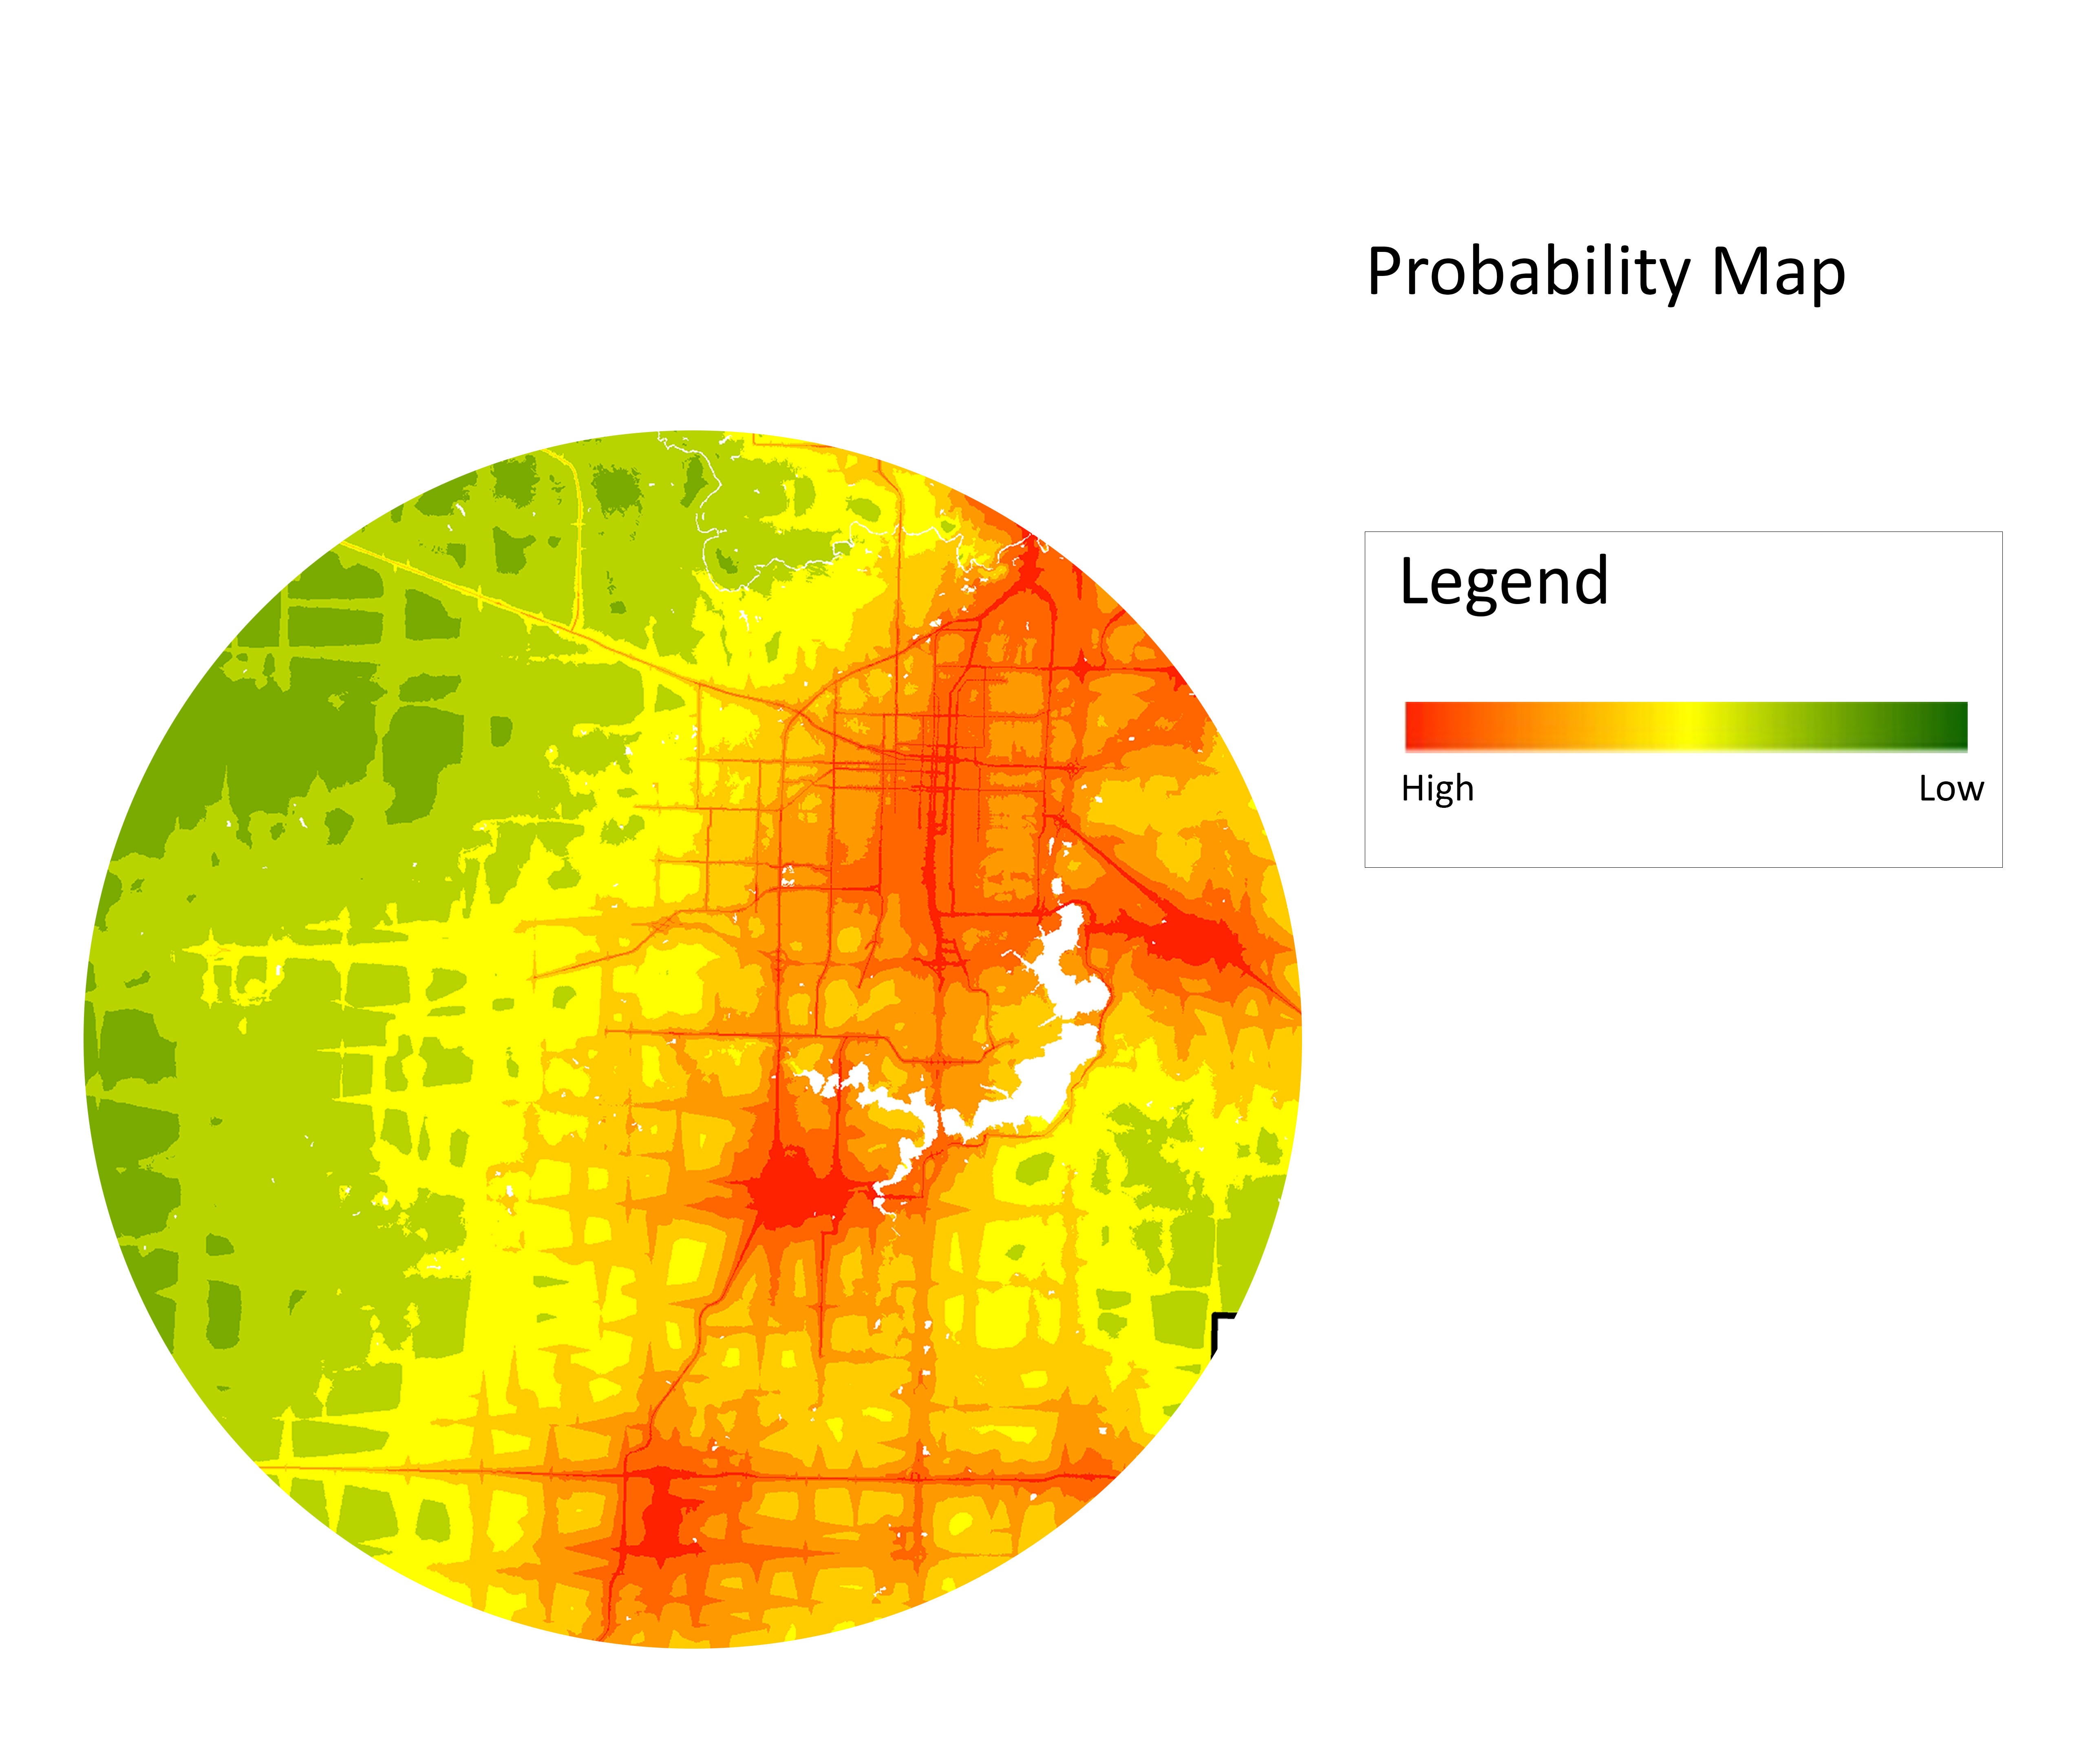
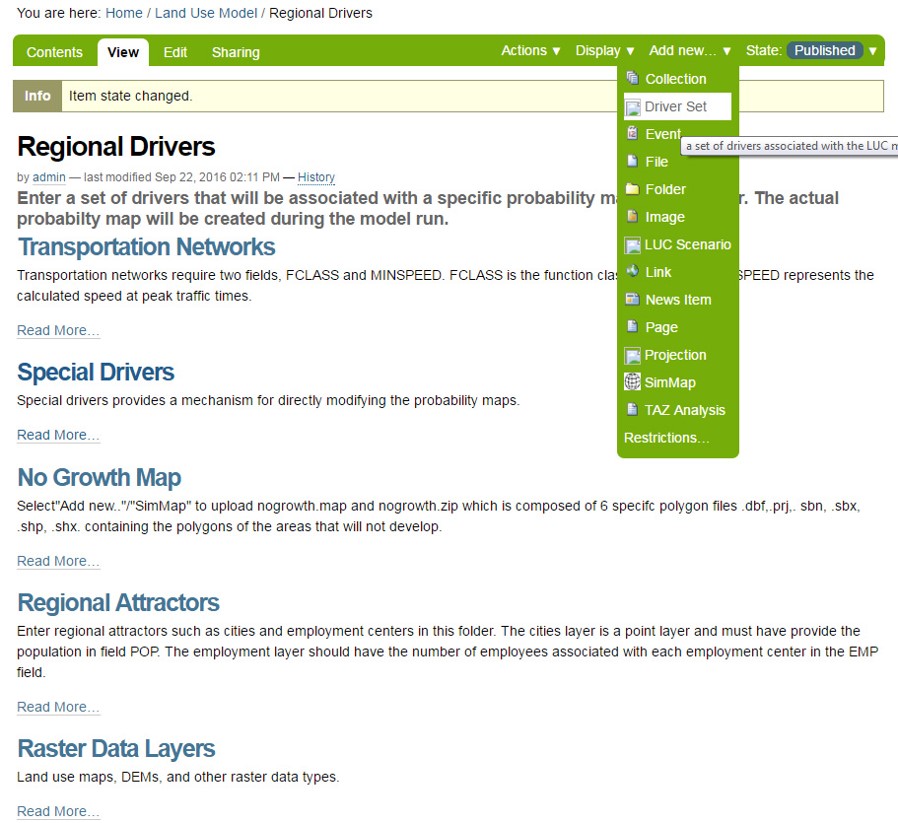
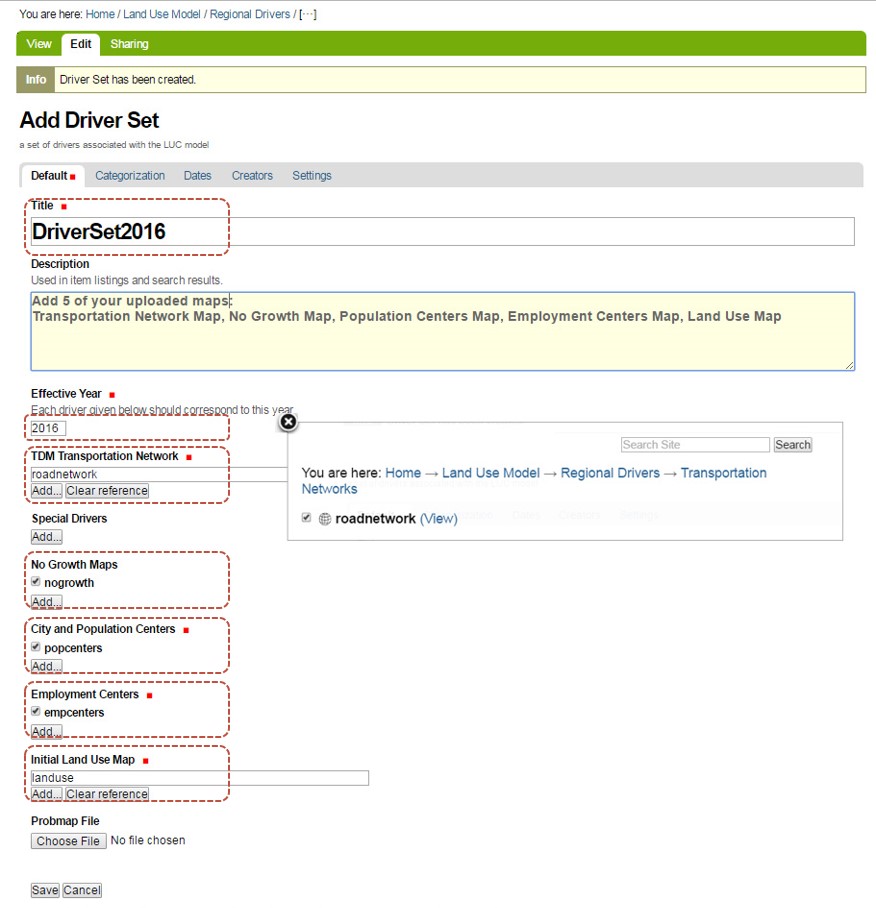
The driver set is used to create the probability map, which determines where cells will be placed.
Follow the steps to load all the uploaded maps to the driverset. A driver set requires the following maps: population centers, employmnet centers, no growth, land use, and road network. Note that the DEM map is used in the background and not required for creating a driverset.
Name your driverste (only contain letters, numbers and underscores).
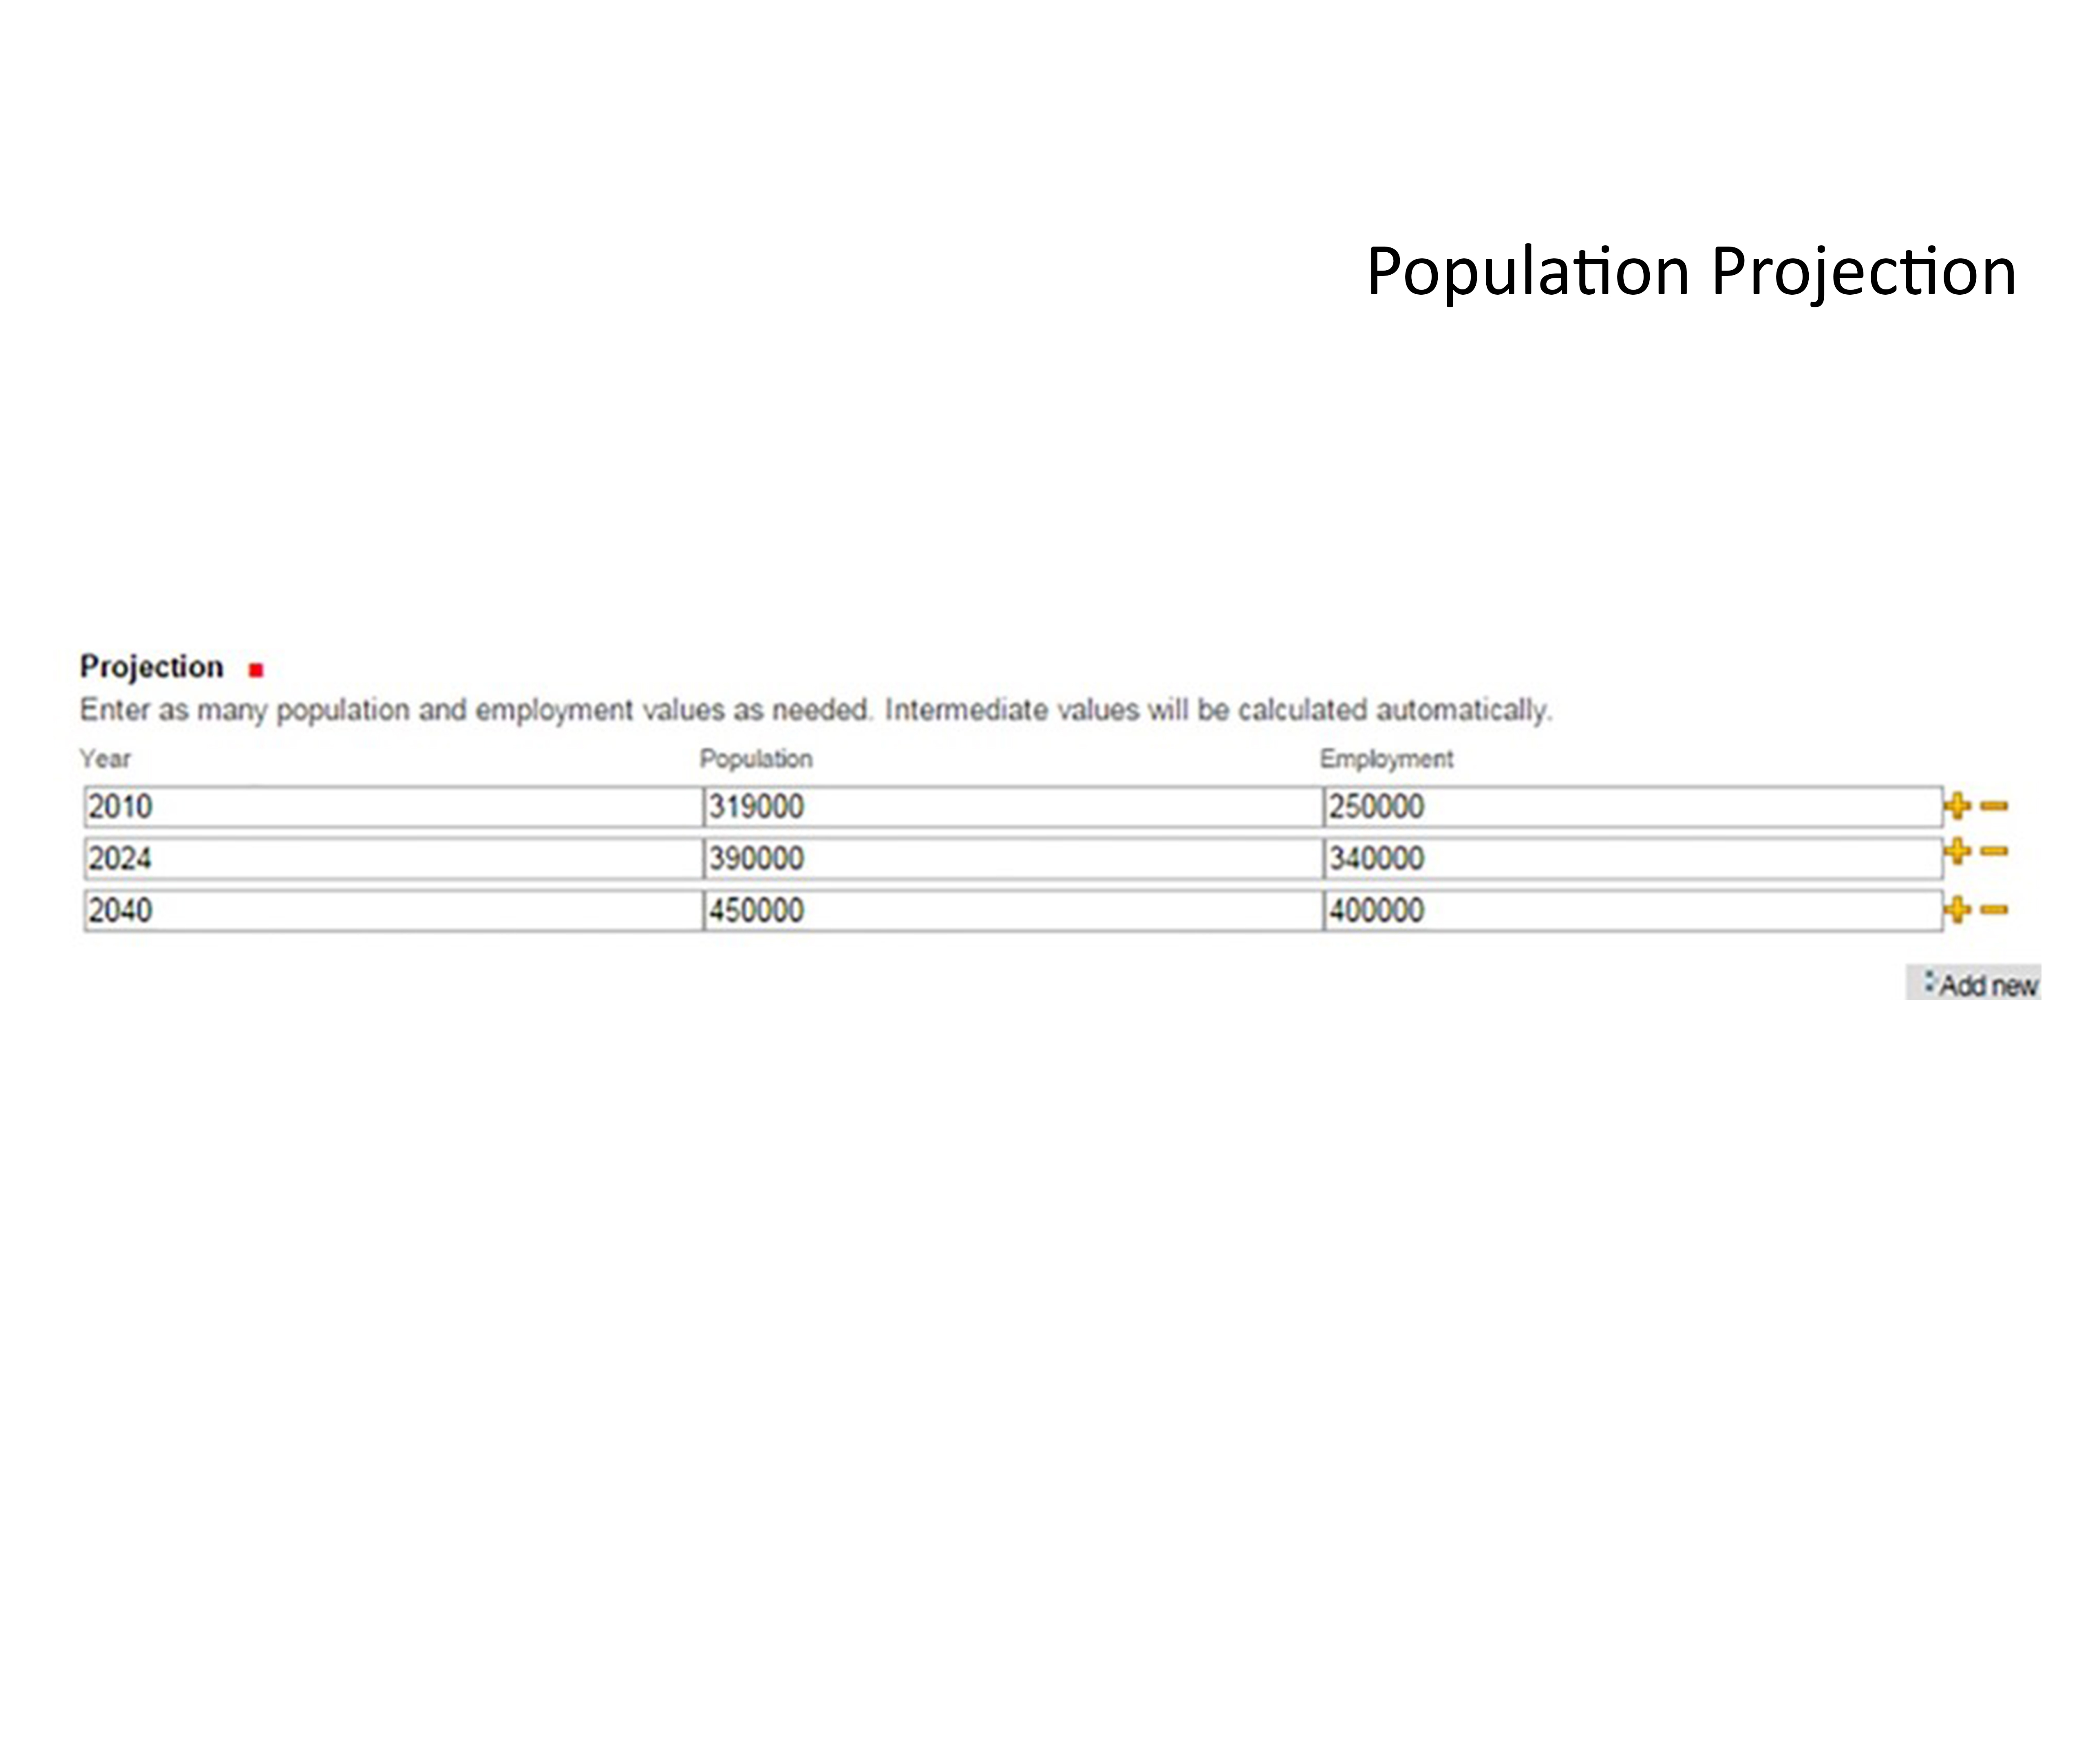
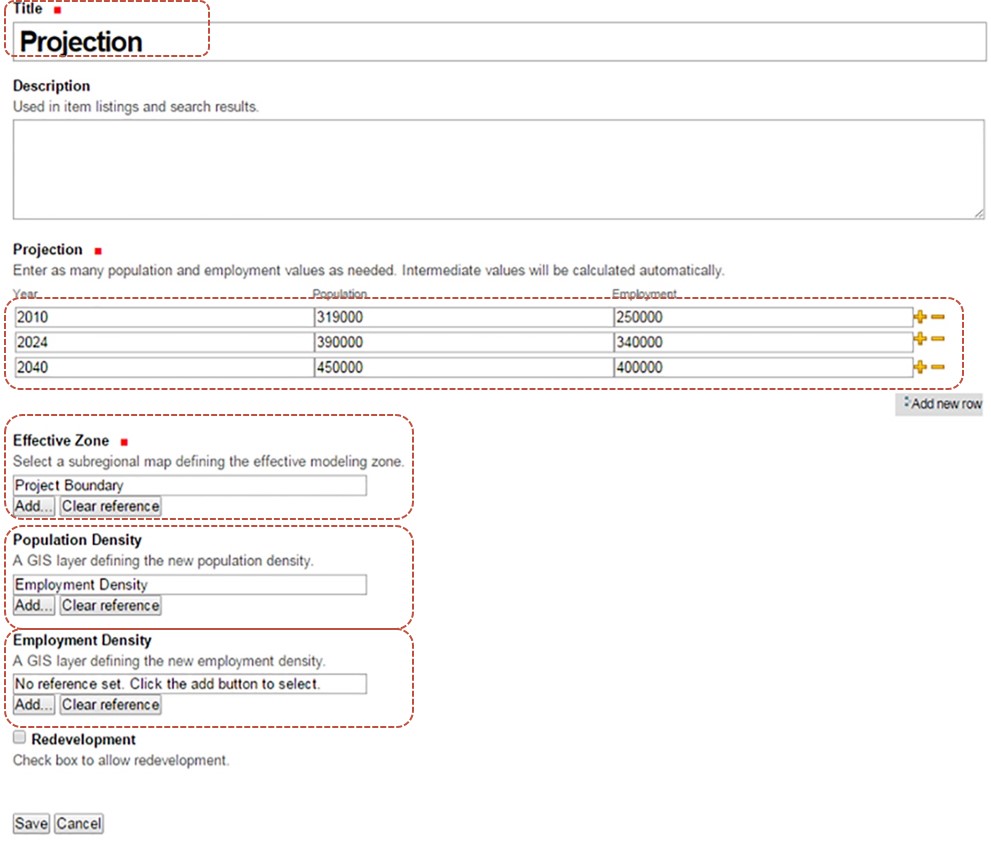
We have provided preliminary population projections for the model. You should use more accurate projection data to replace our estimates. The values provided in this step determine the number of cells that will be allocated in the model.
The data you need to insert in the boxes include projected populations, employments and the corresponding year for each.
Note: 1) After you save the scenario, the model will run. 2) When a map is changed for an alternate scenario, you'll need to create a new driverset and scenario.
Wait 30-40 minutes for the model to compute.
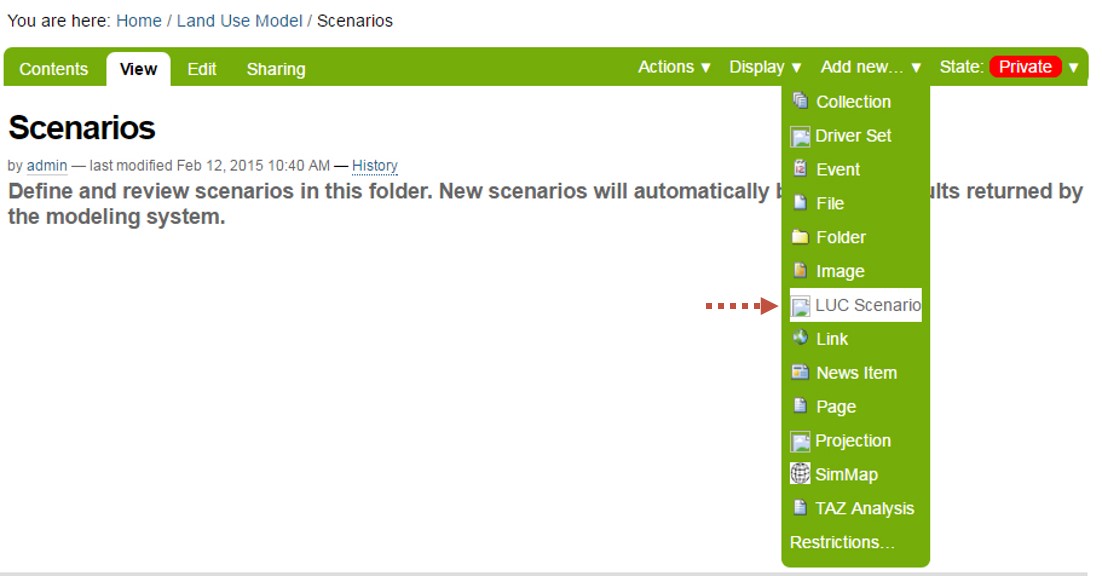
Name your model (only contain letters, numbers and underlines).

Click on the following link to go to "Scenarios" window.
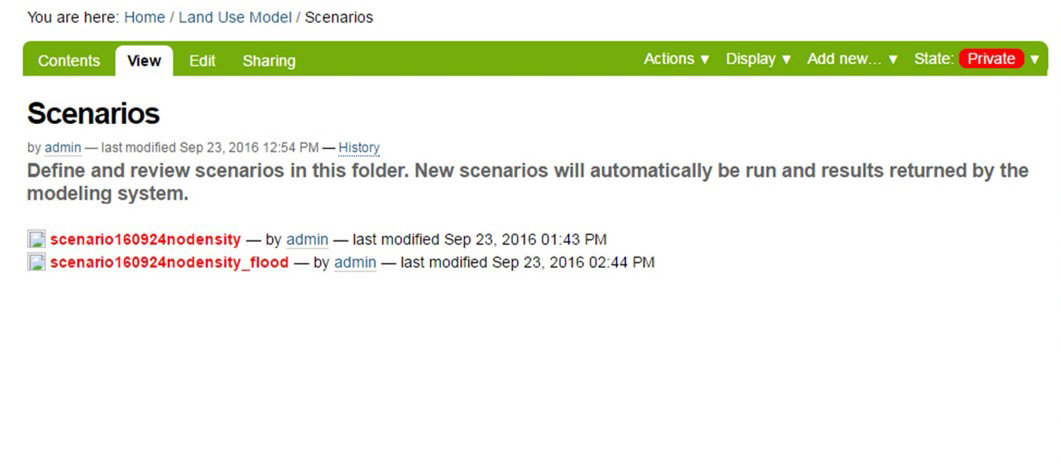
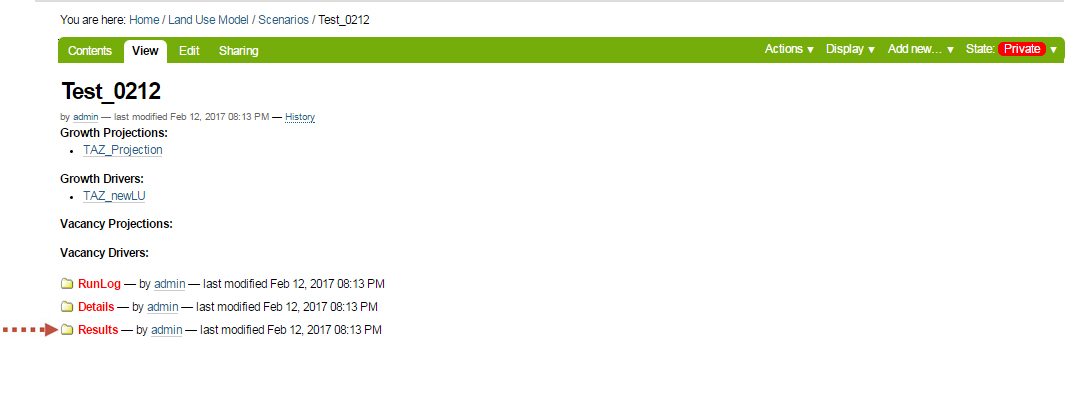
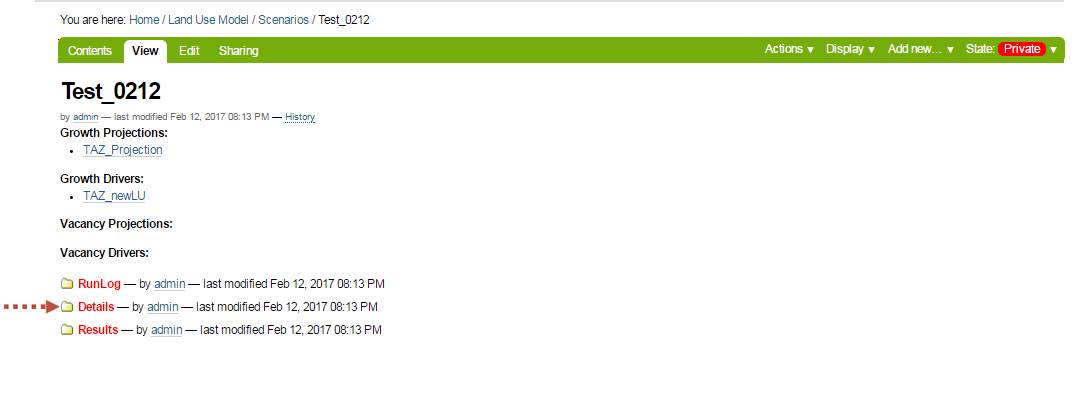
The valuable model results are under "Results" folder.
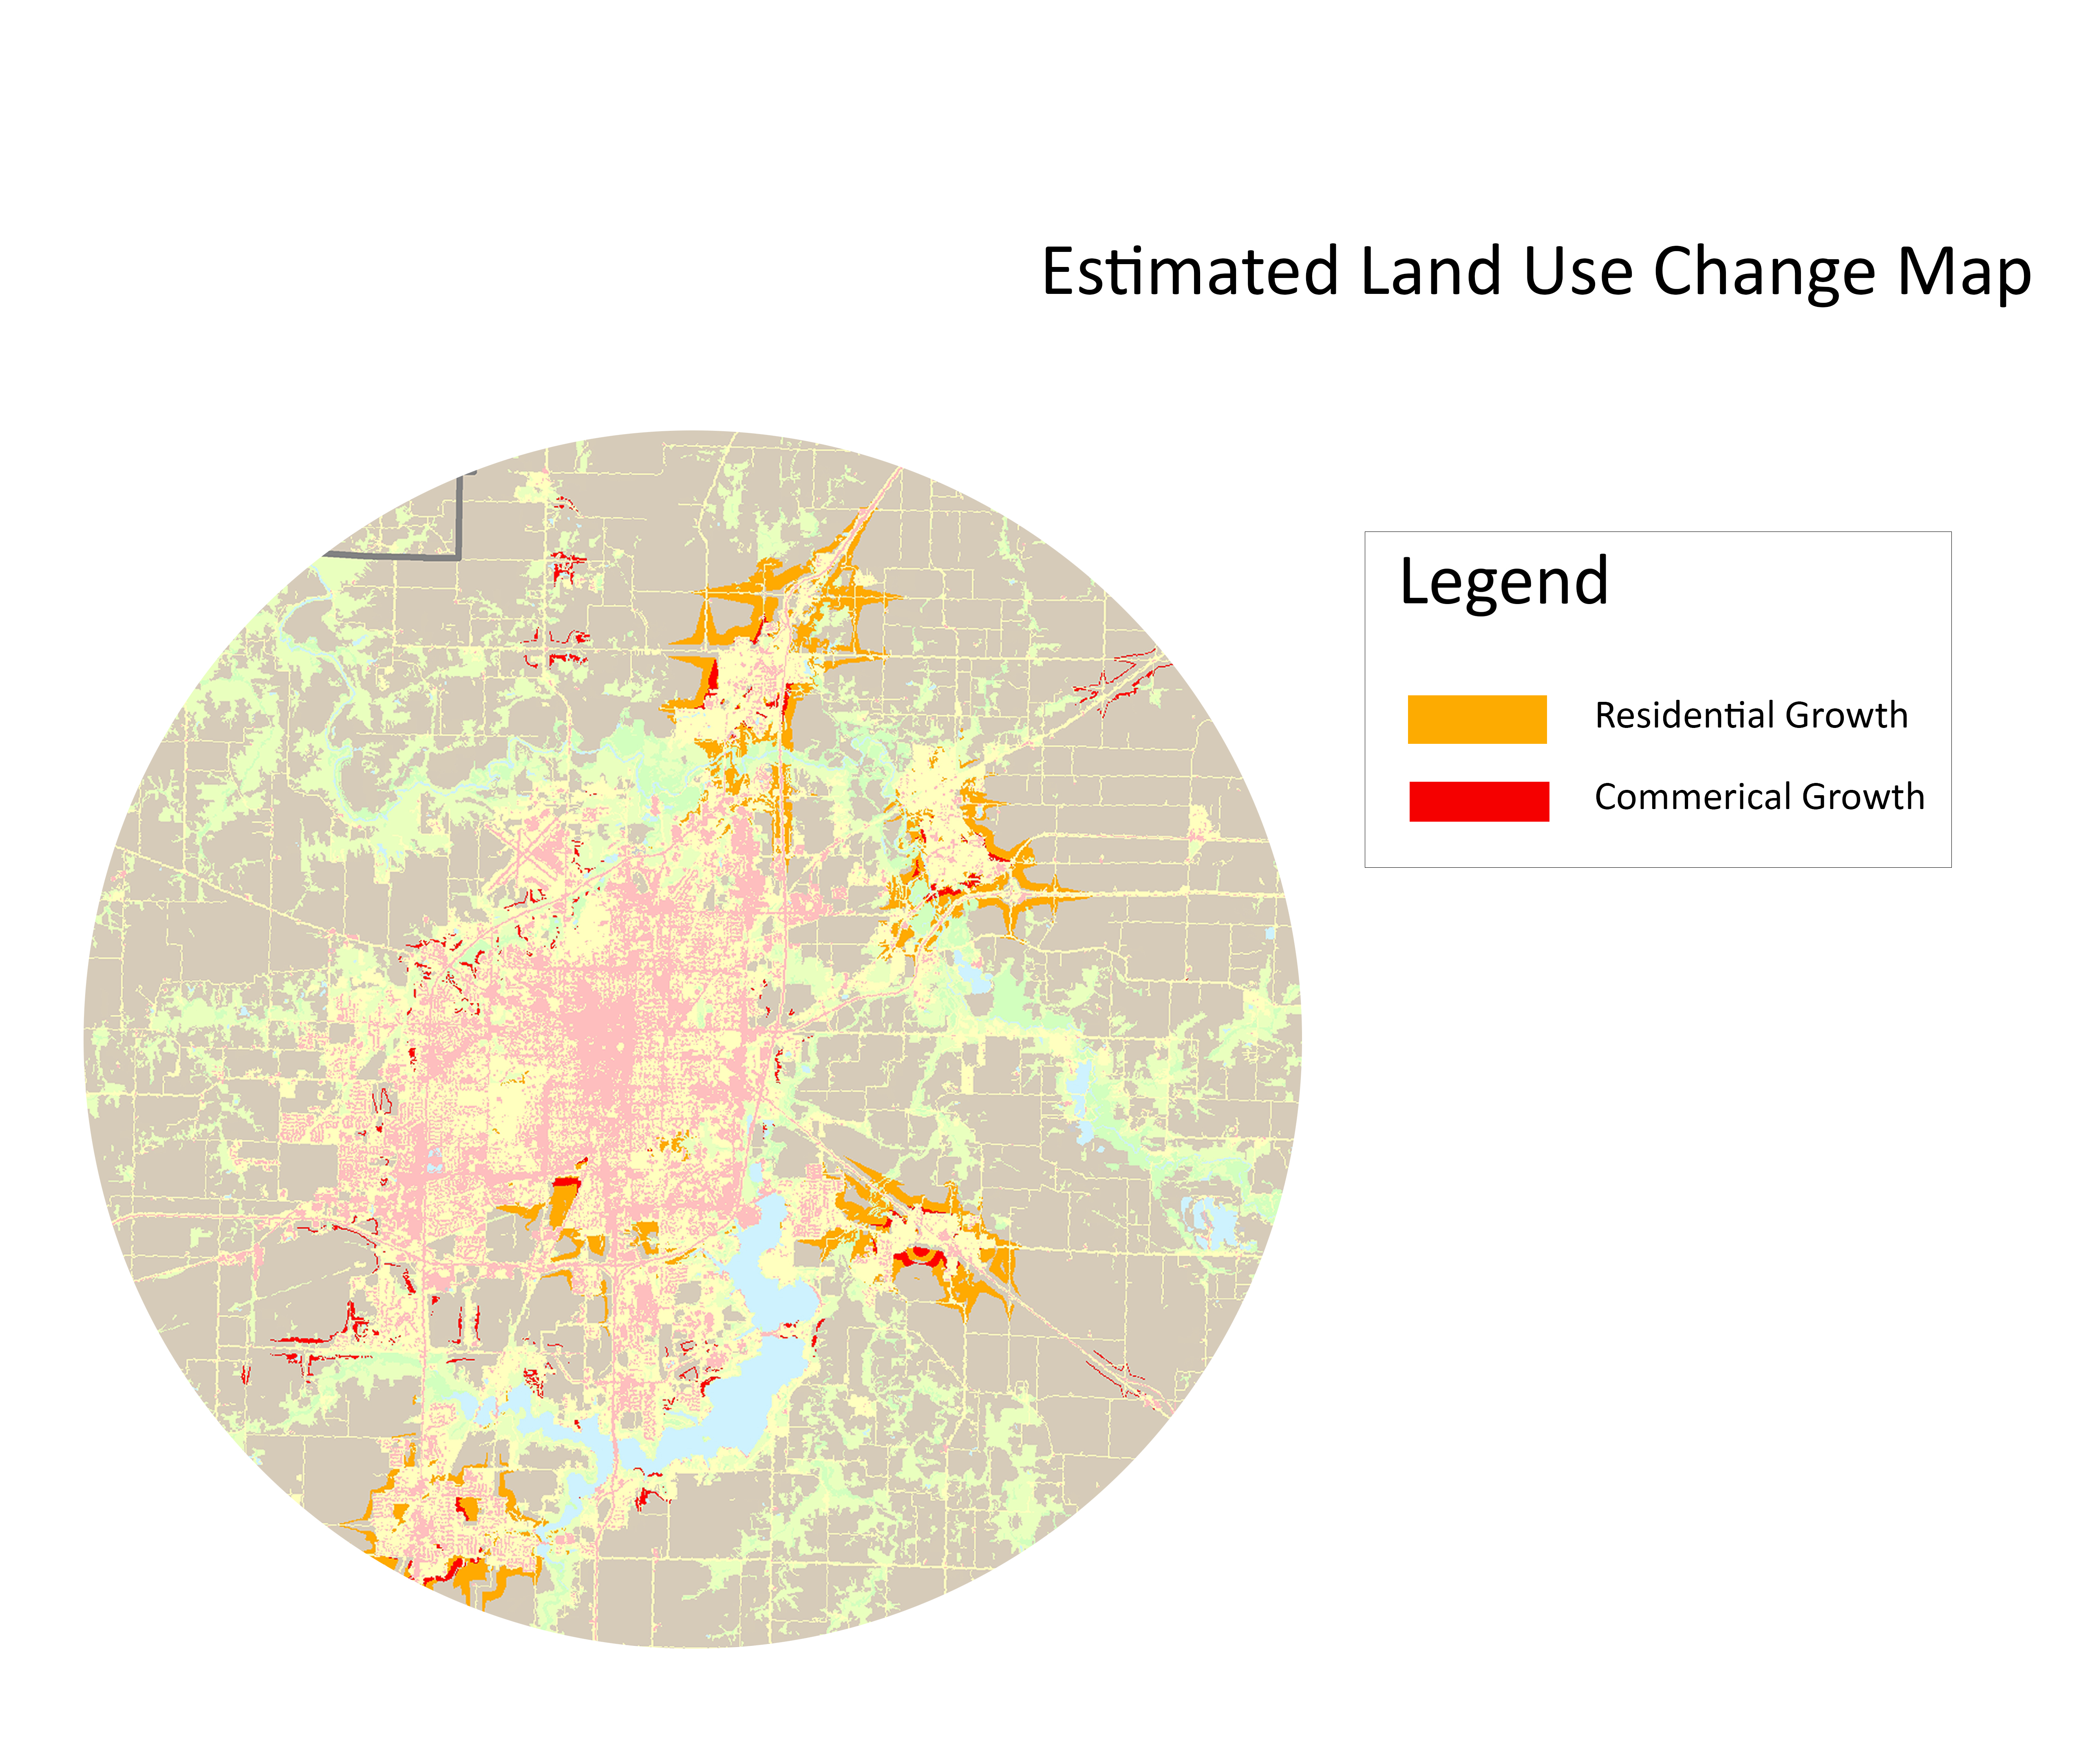
CHANGE MAP shows the estimation for the commerical growth and residential growth allocation by the end of estimation year.Yellow cells represents residential growth. Red cells represents commerical growth.
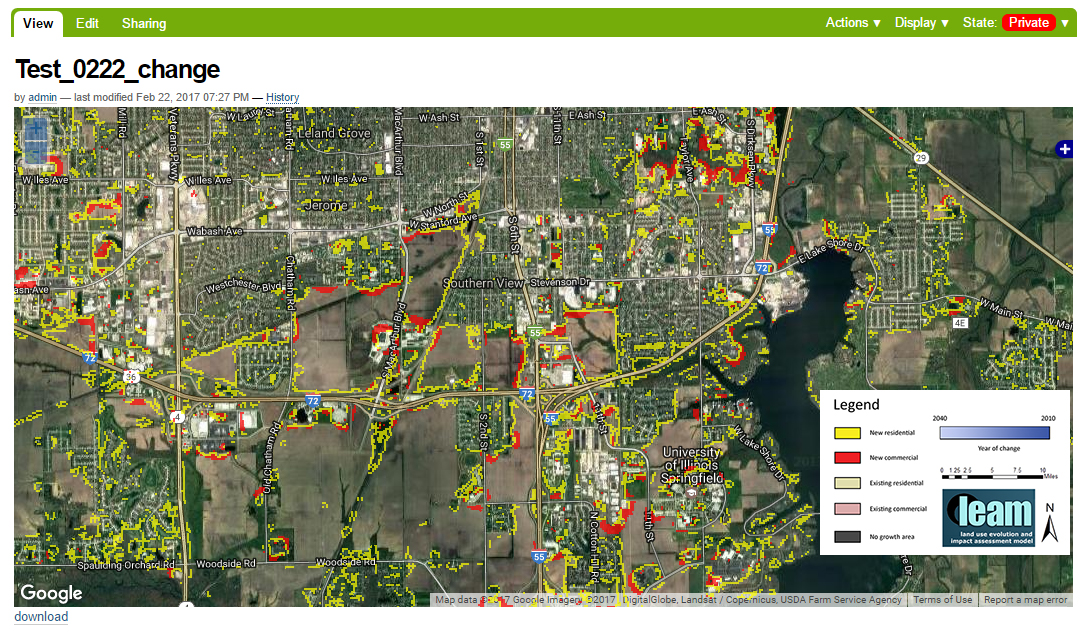
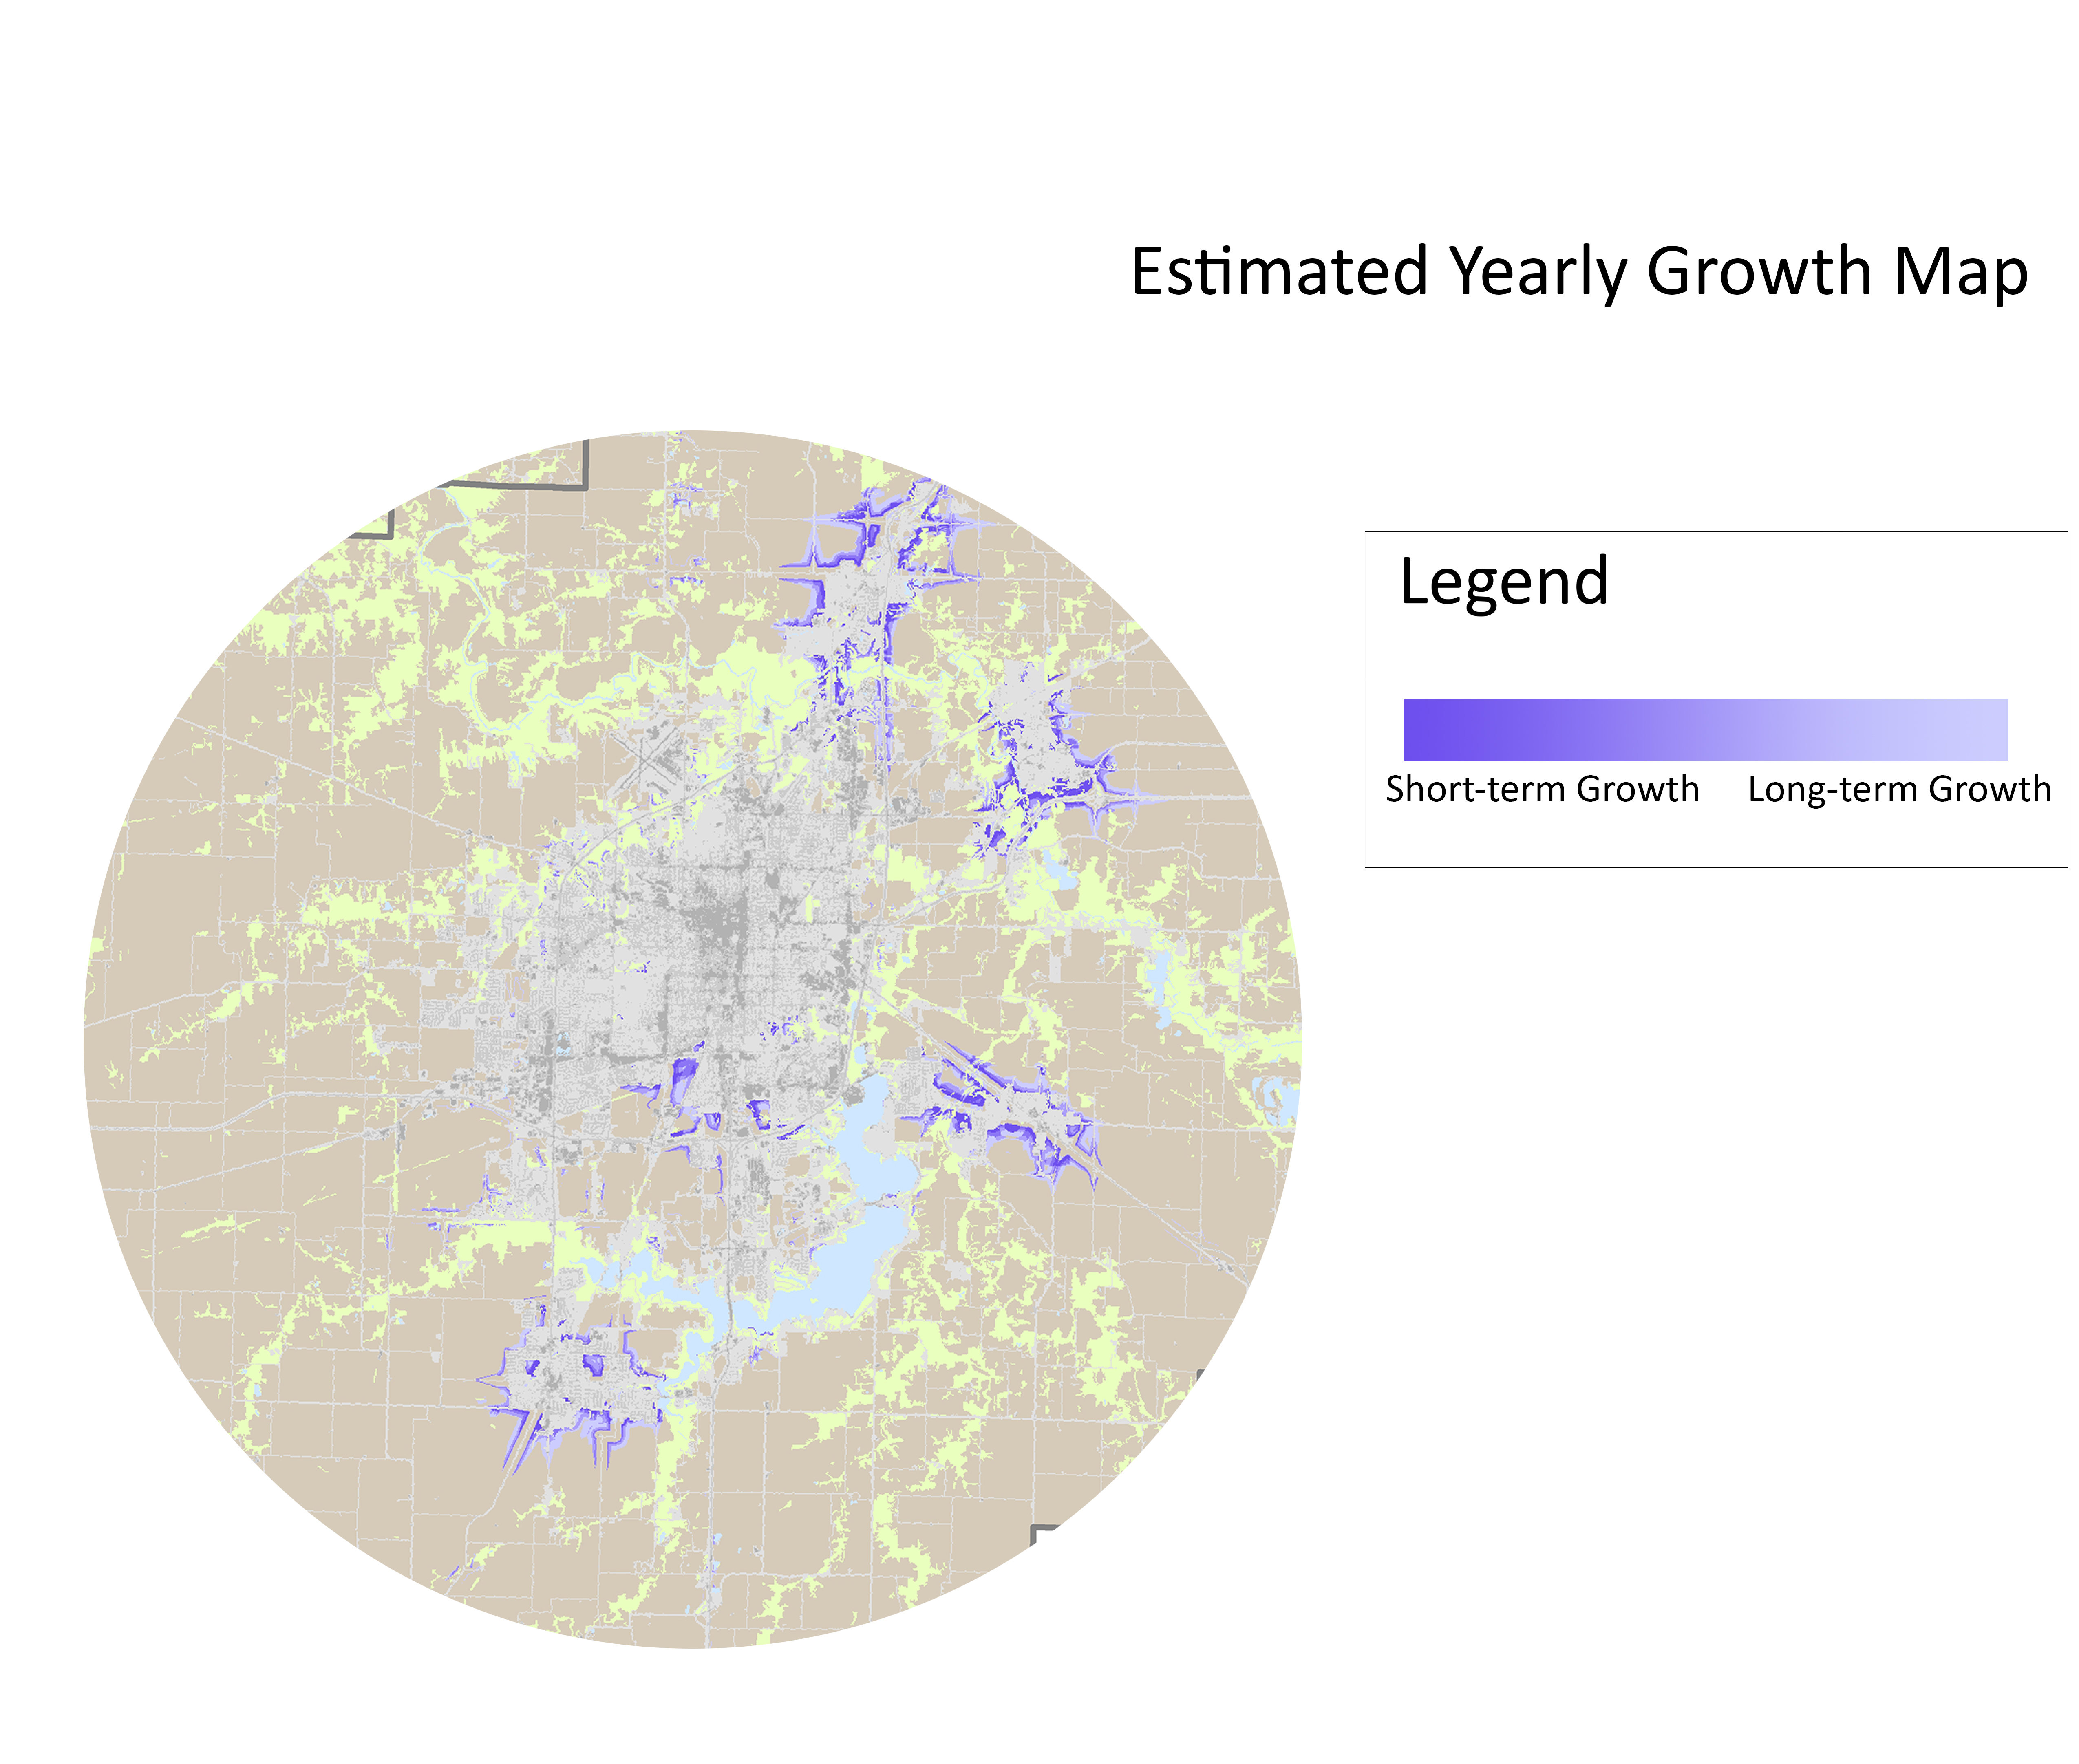
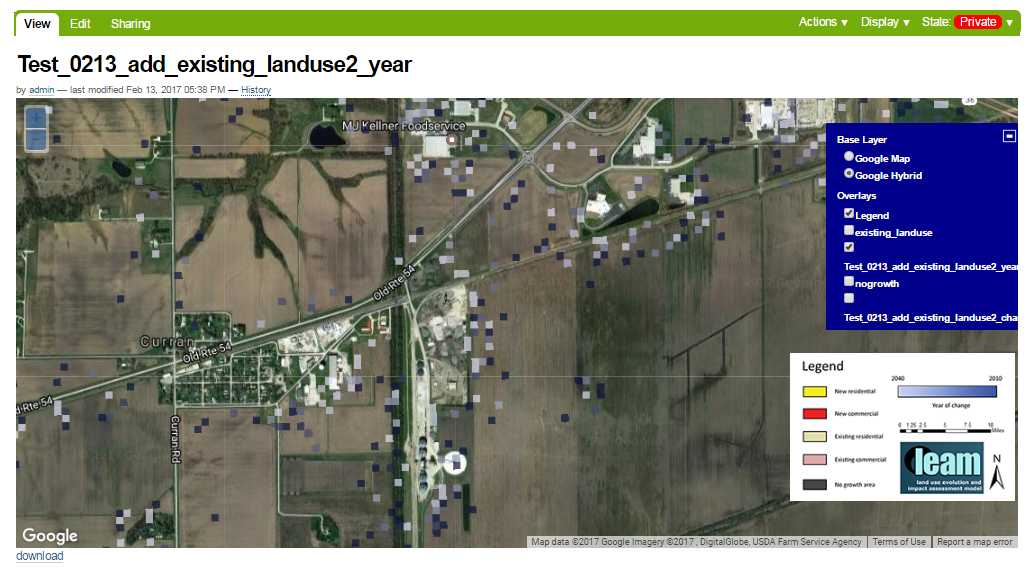
YEAR MAP shows the estimated urban area growth every year.The most recent growth is represented by the deepest purple color.
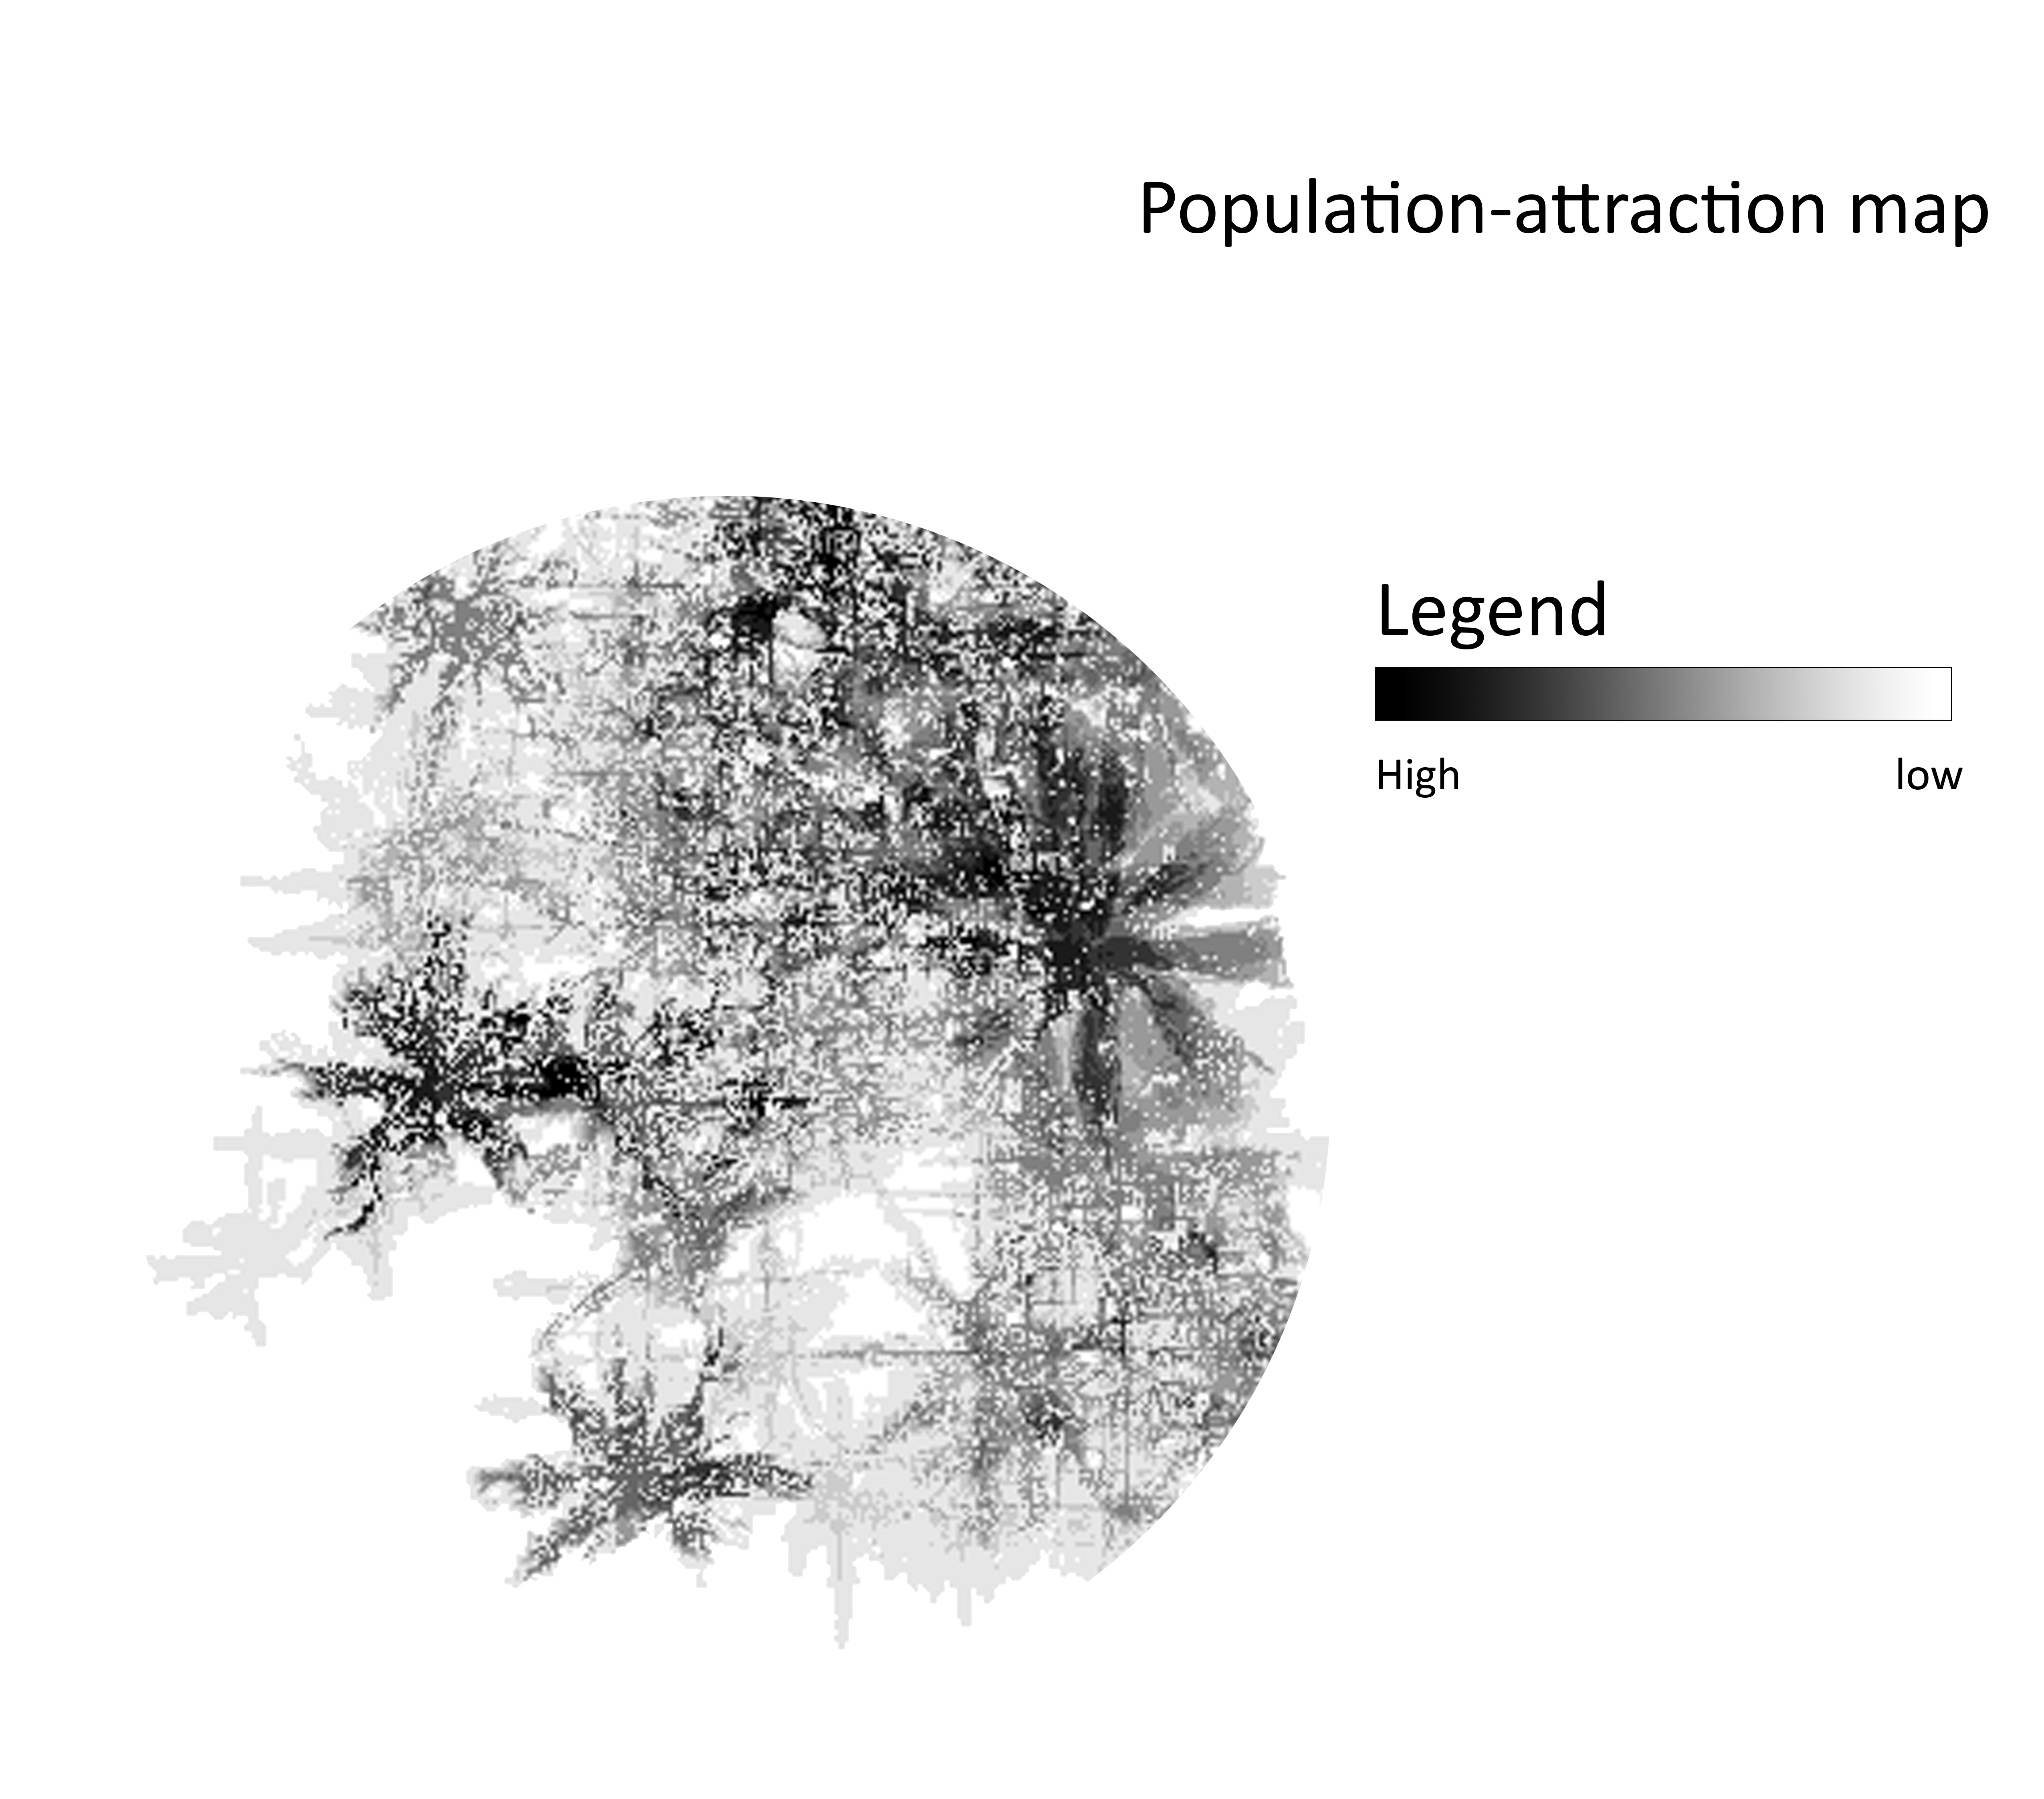
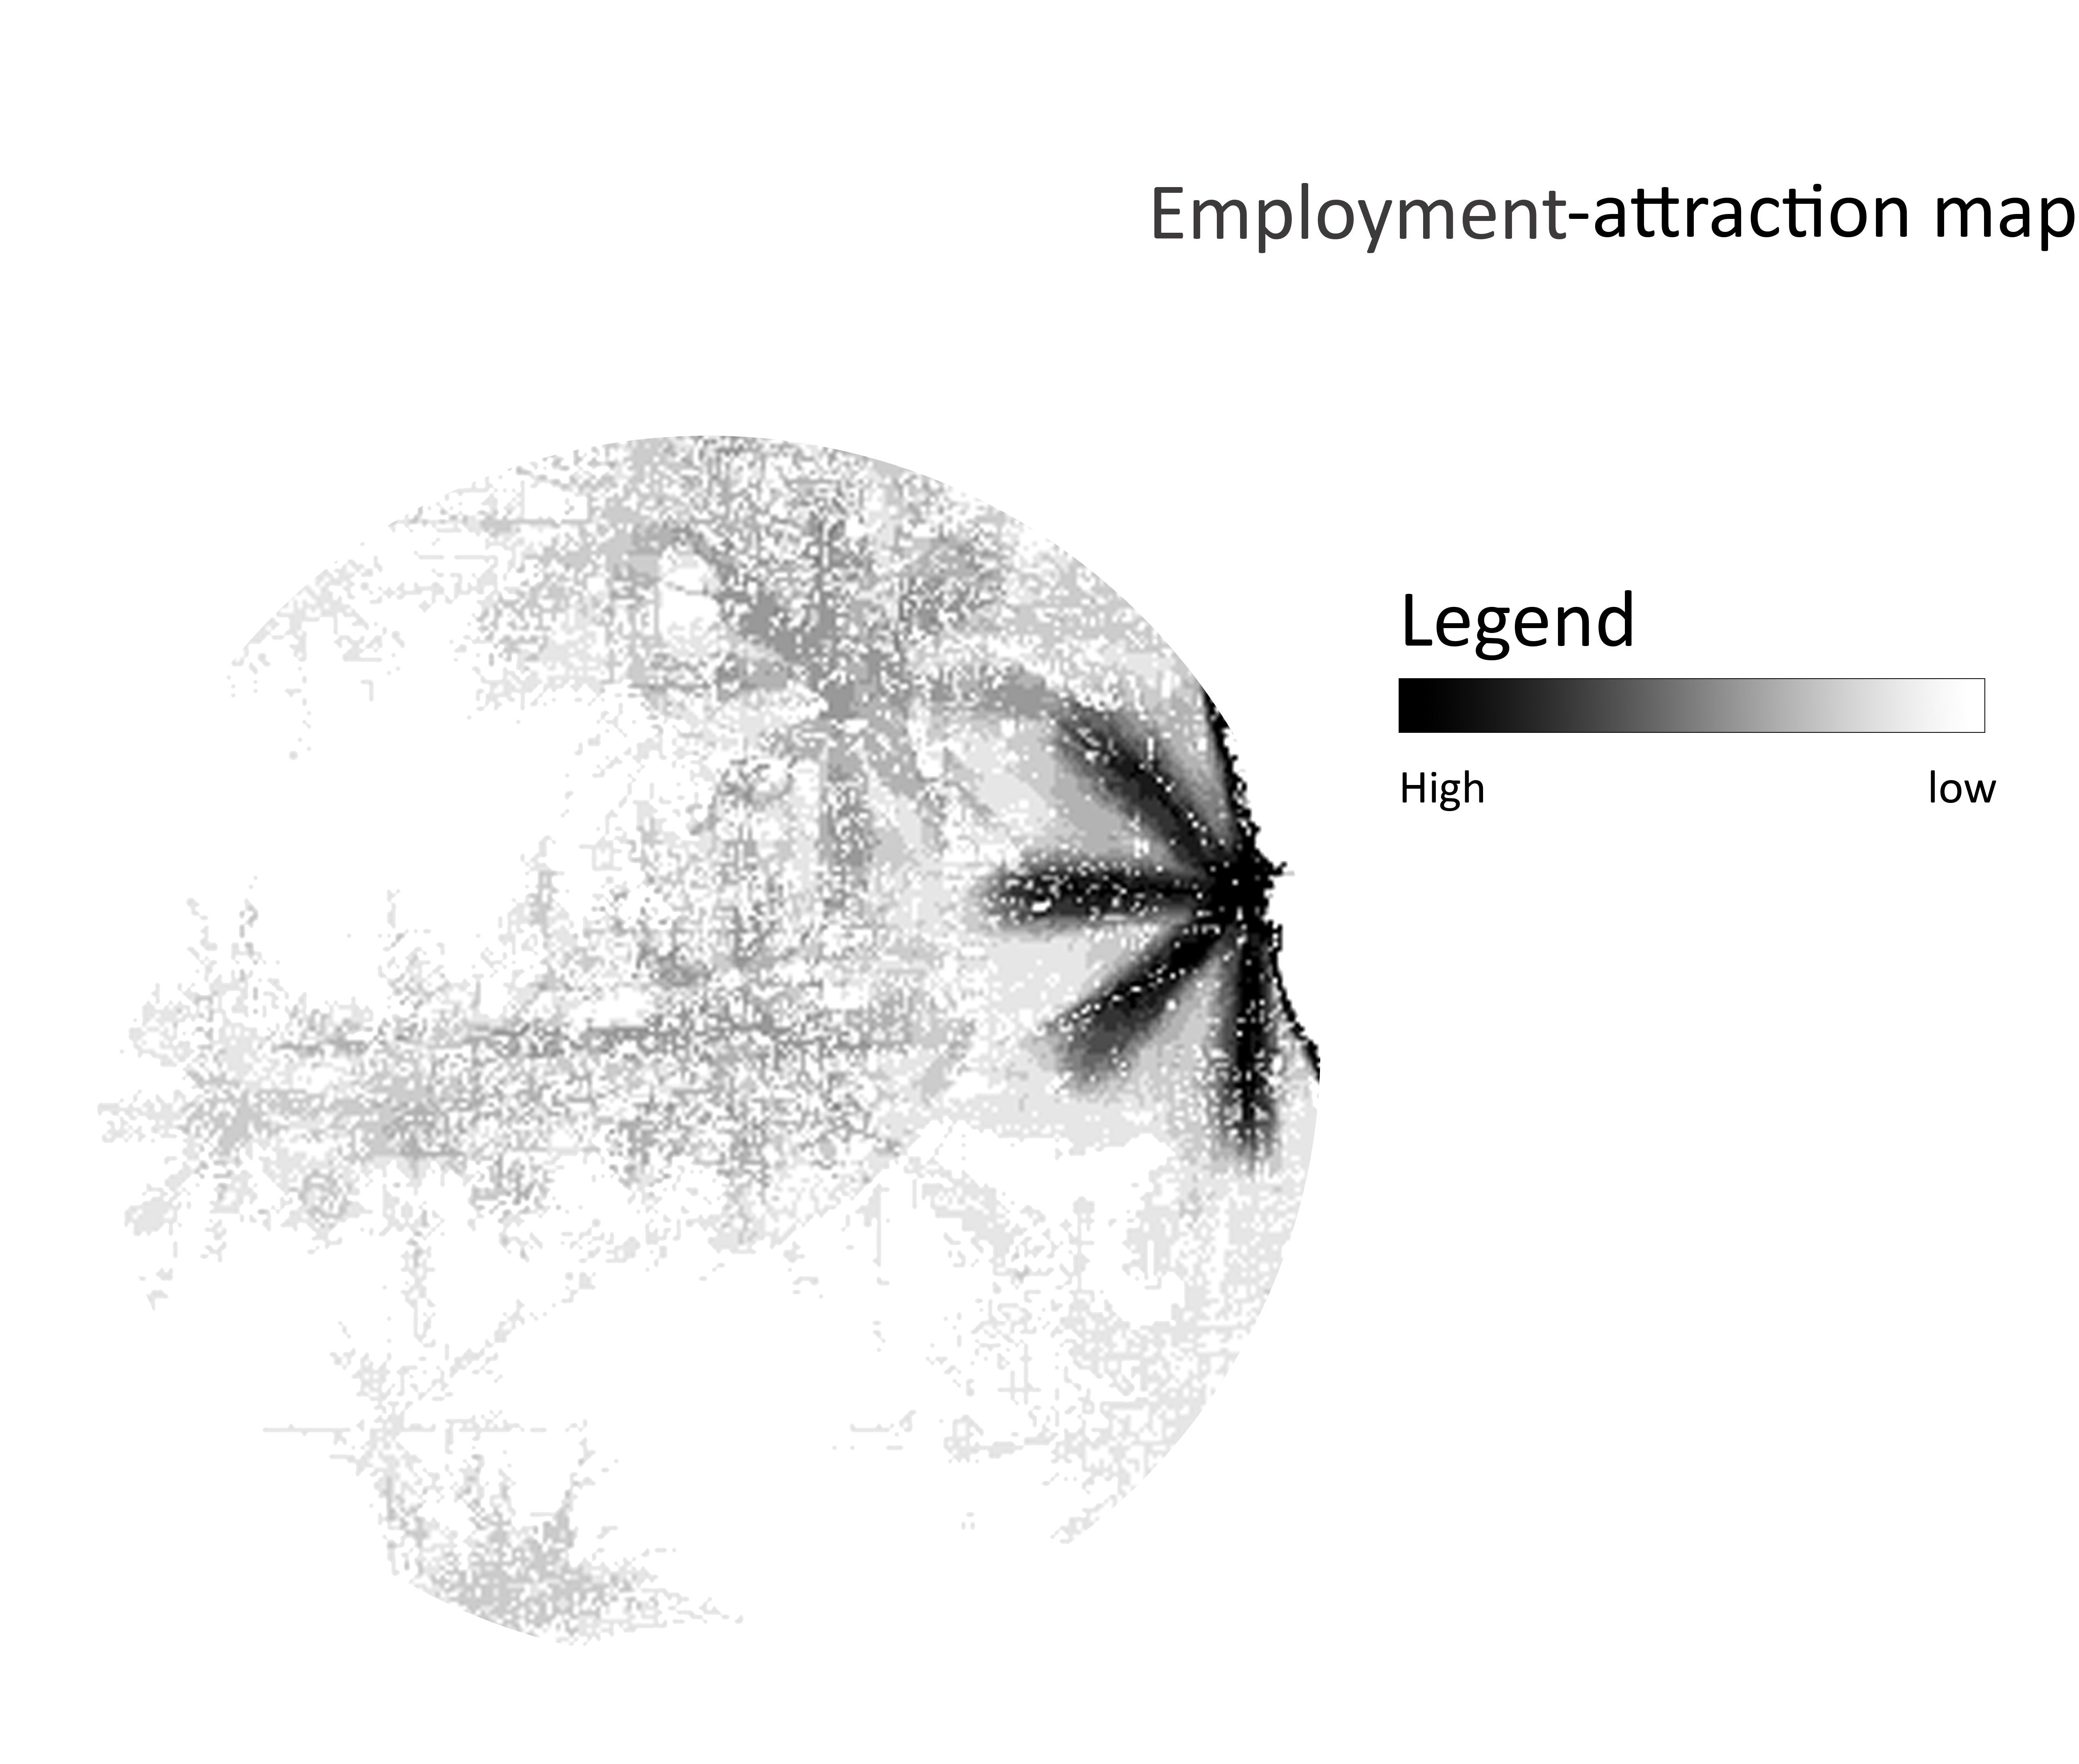
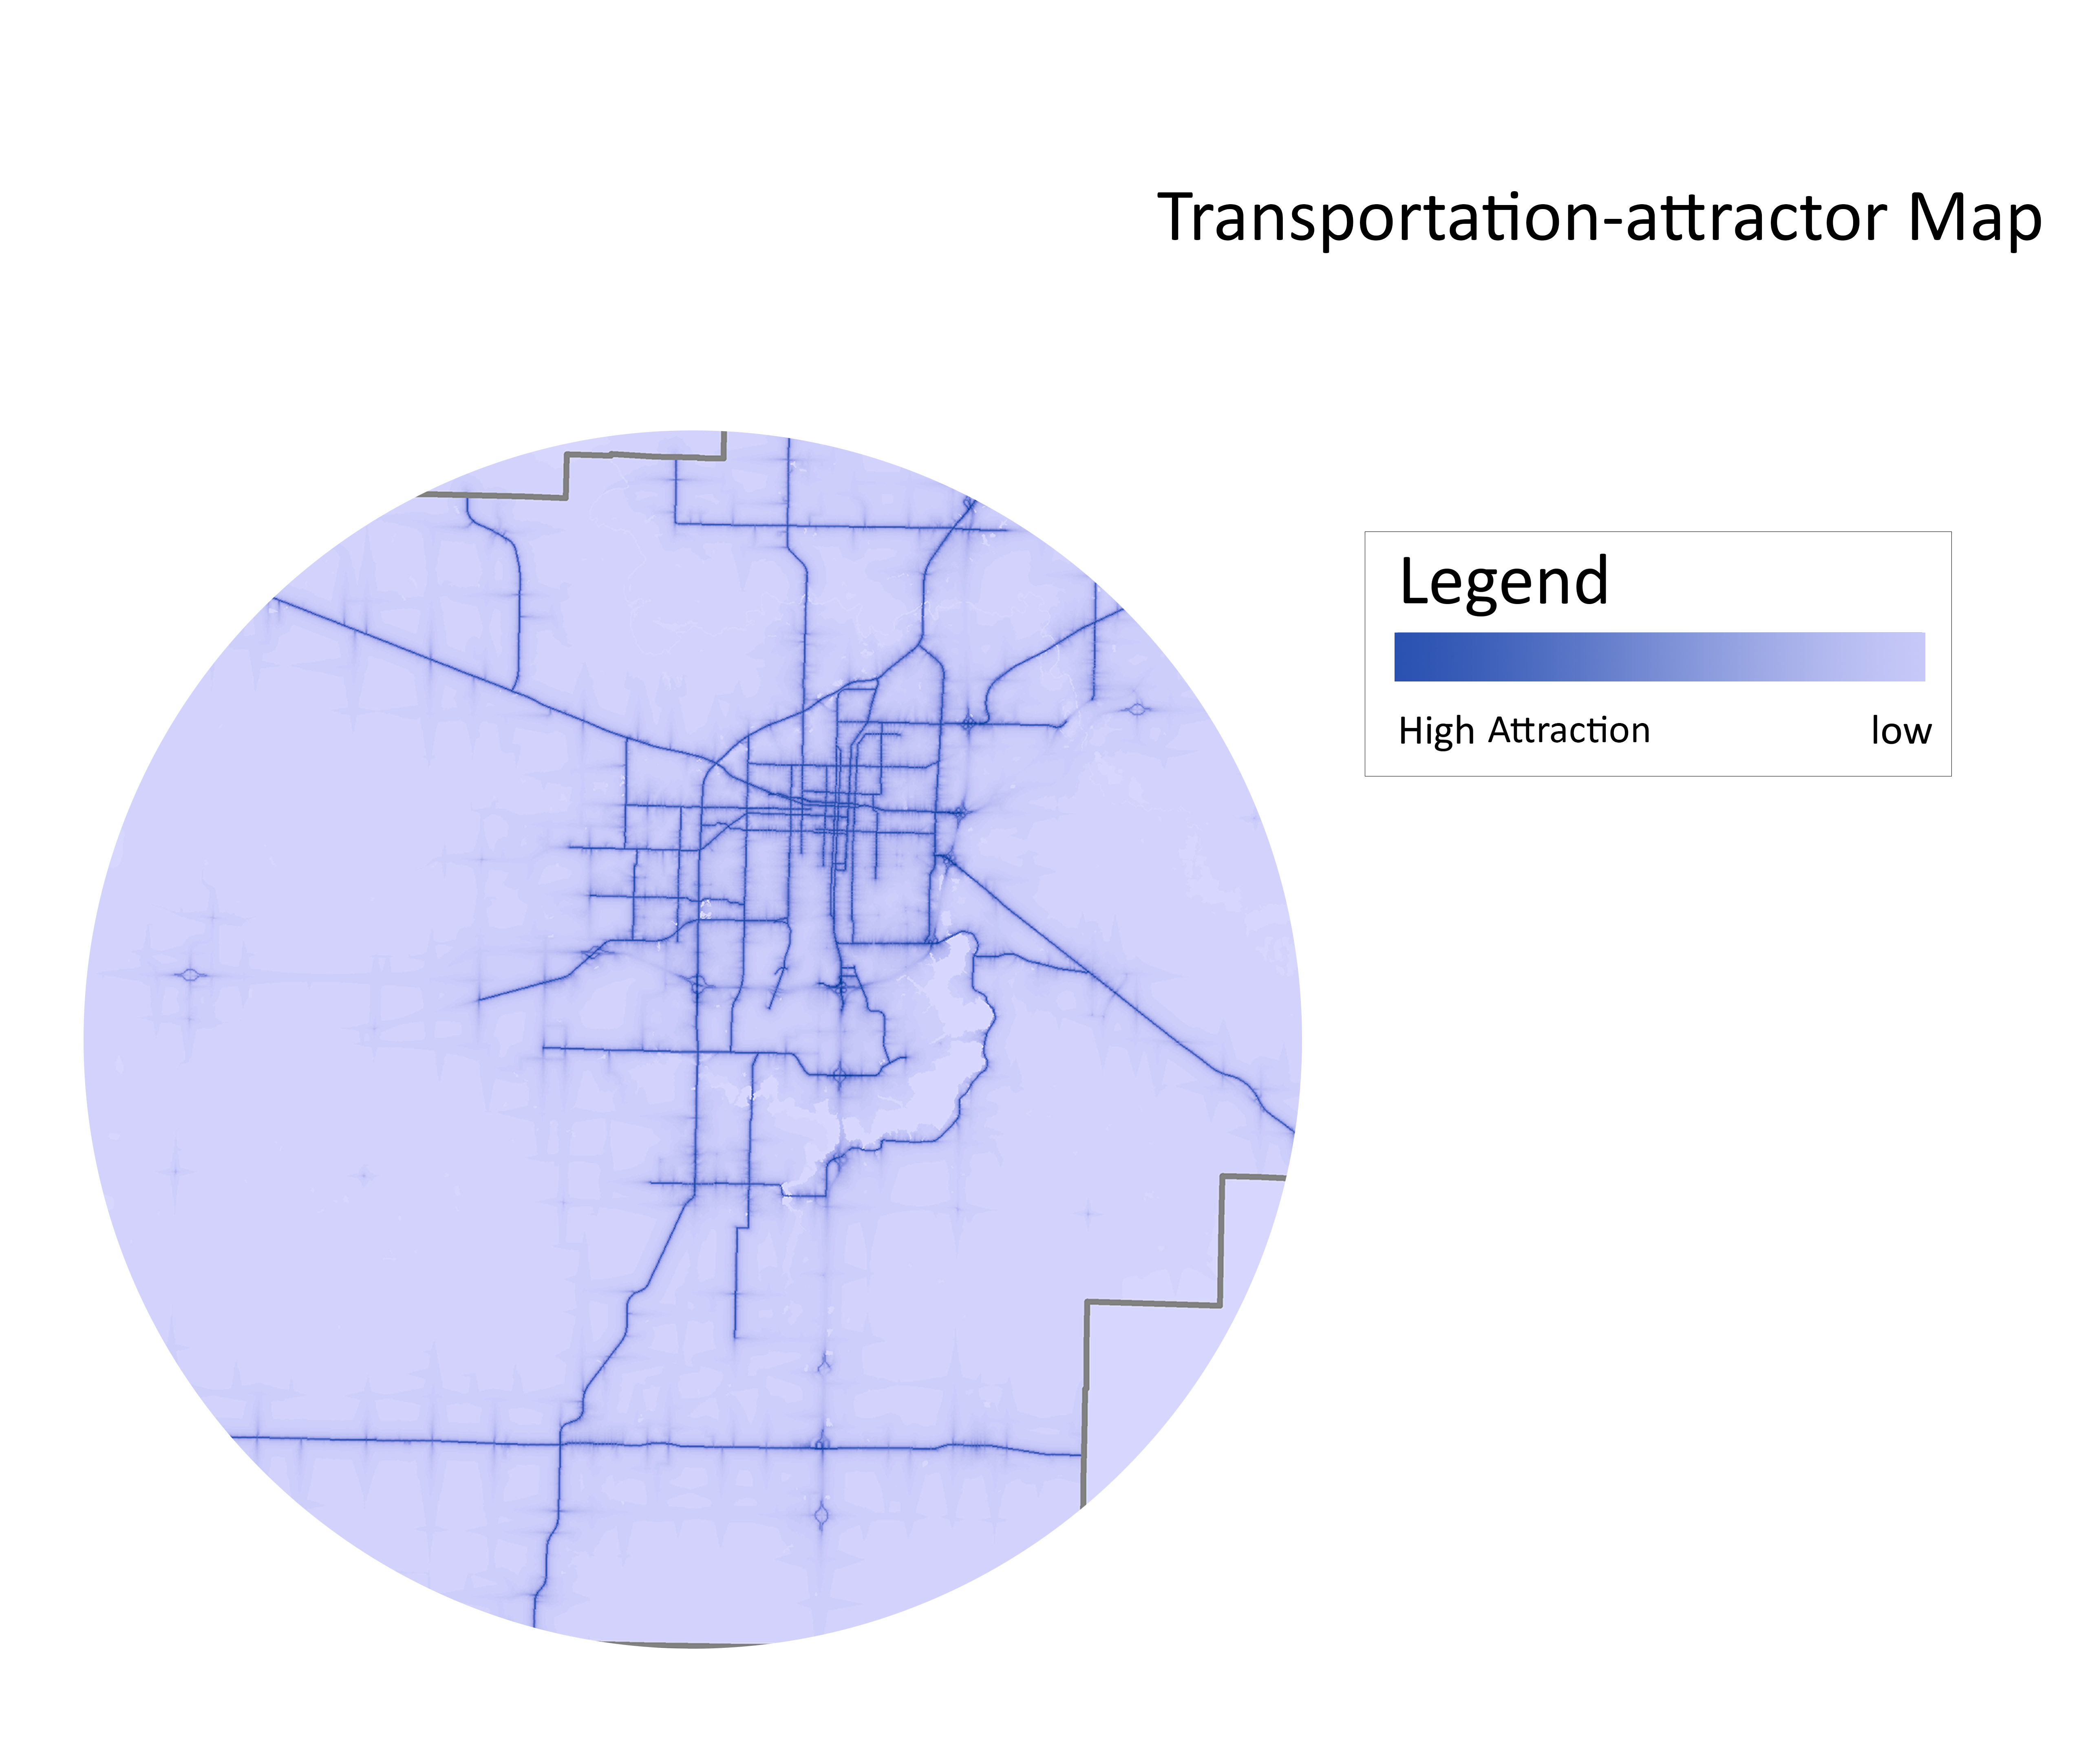
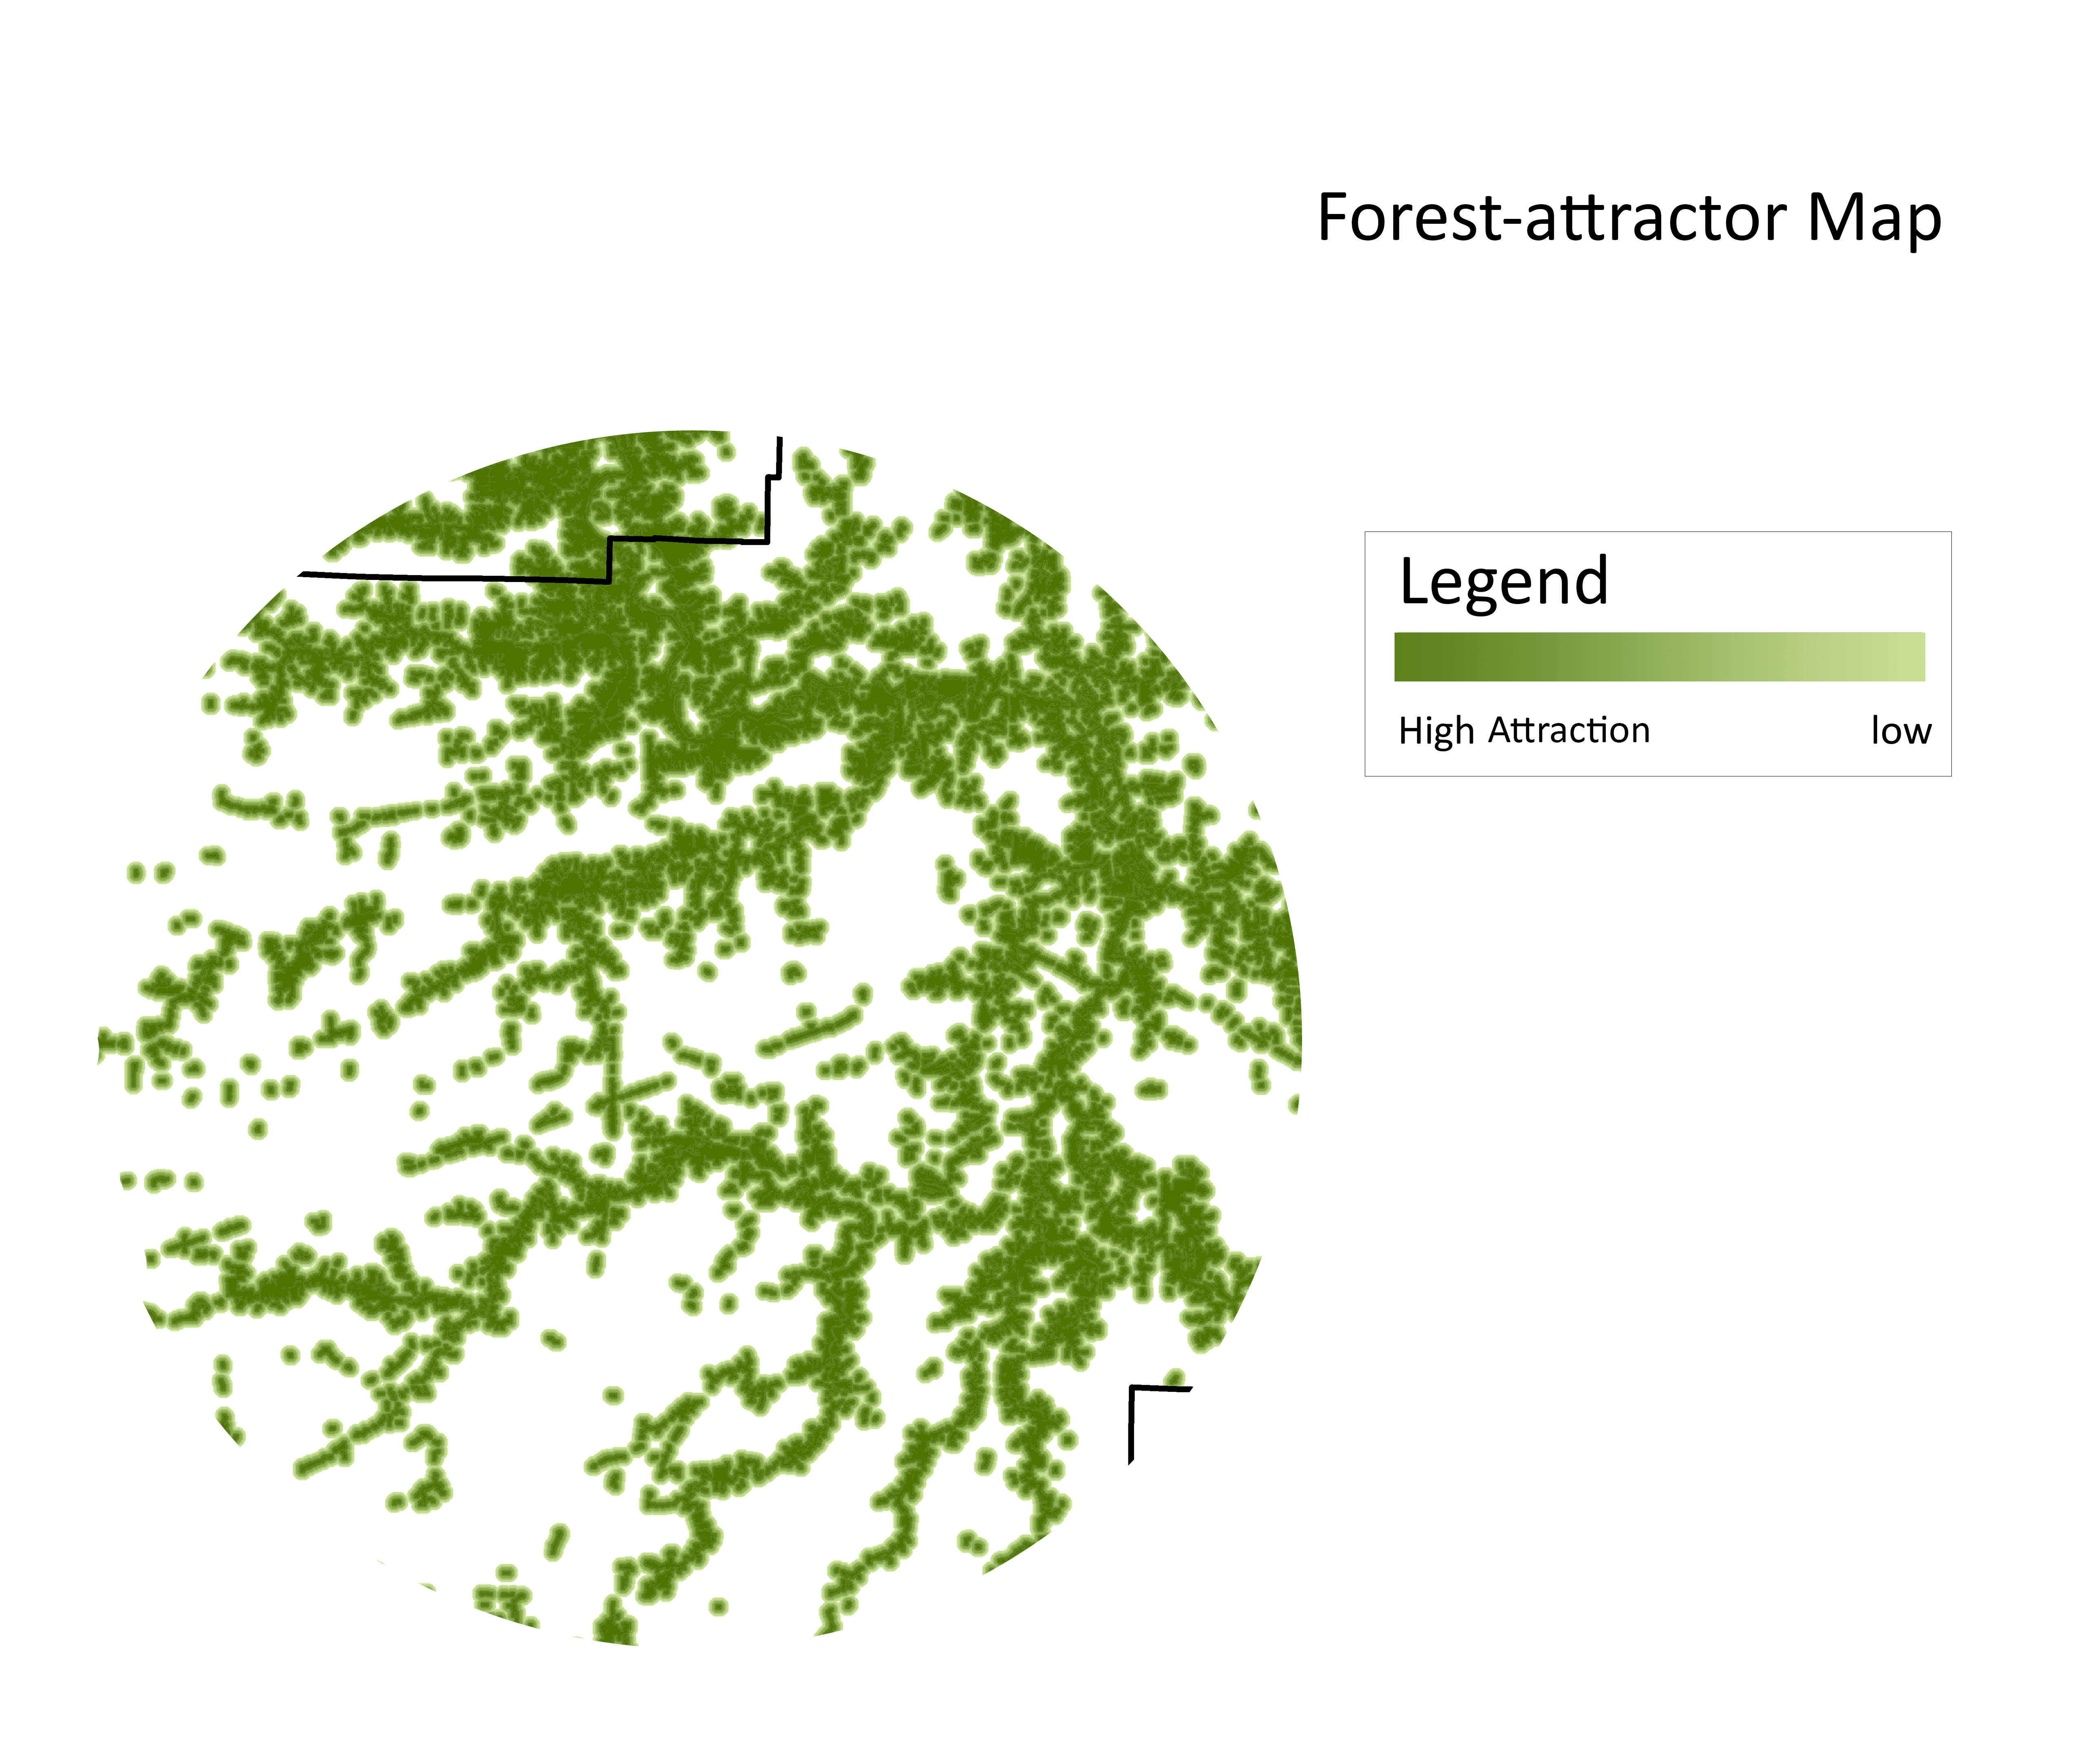
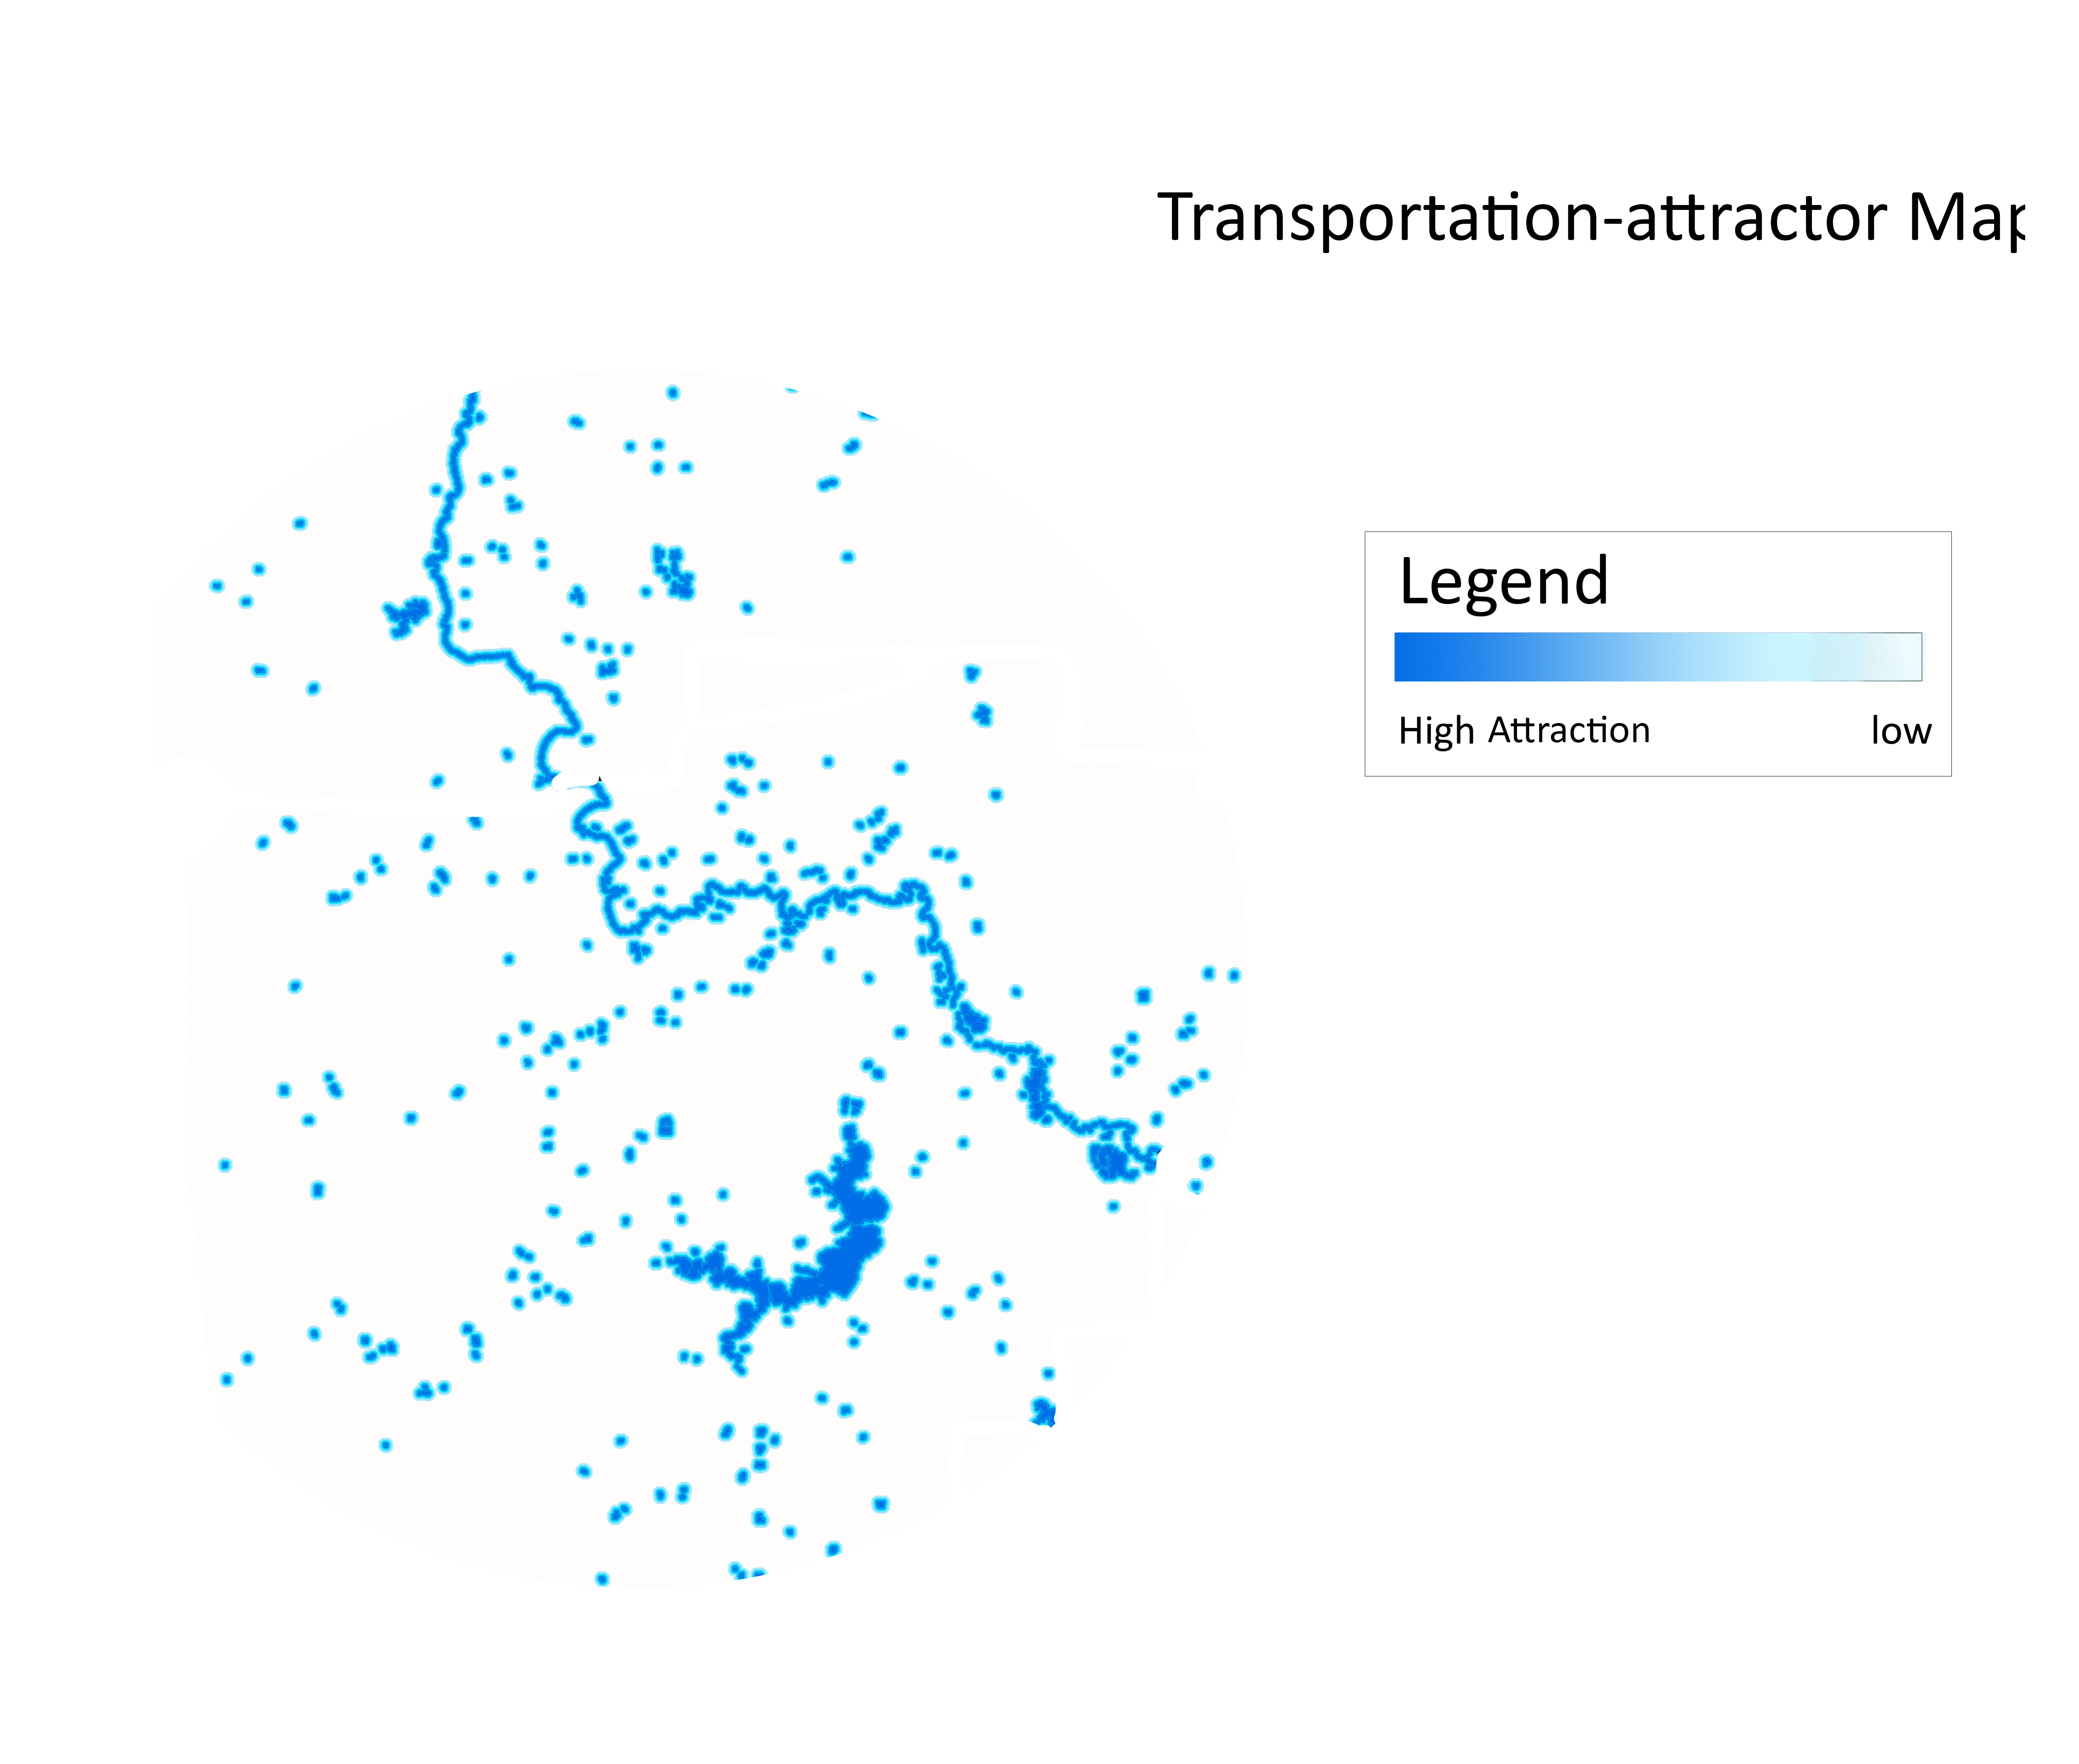
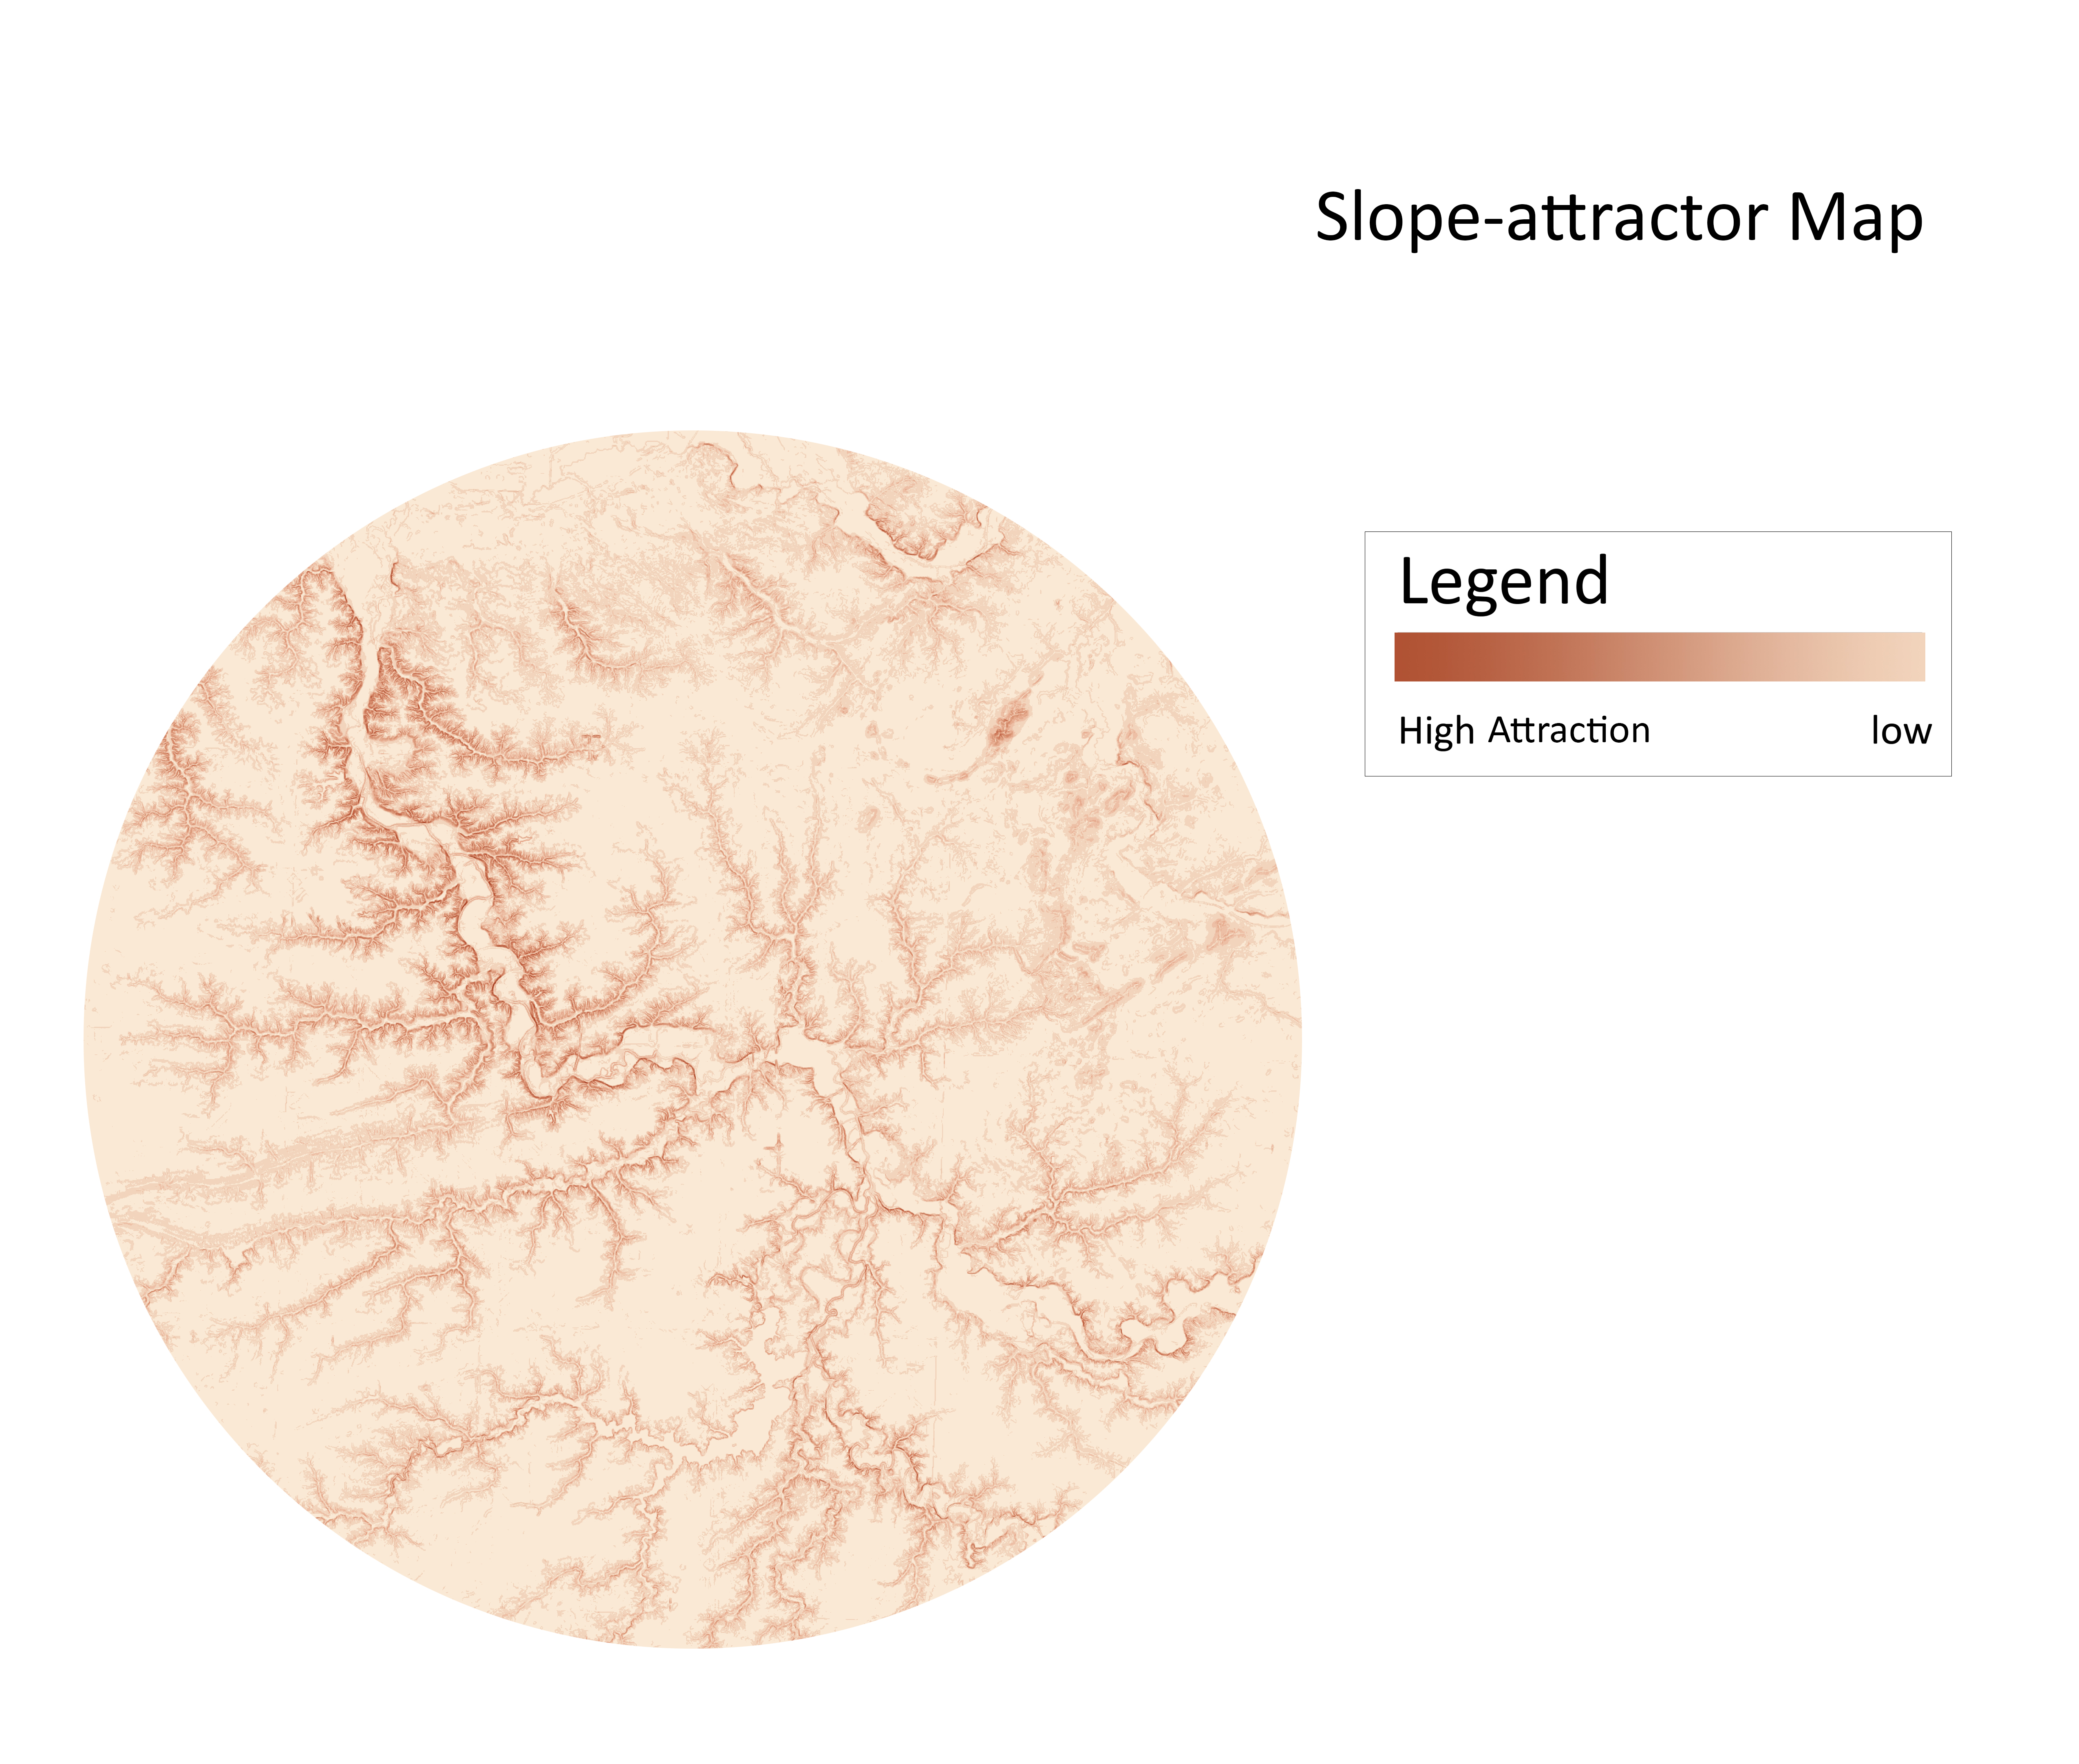
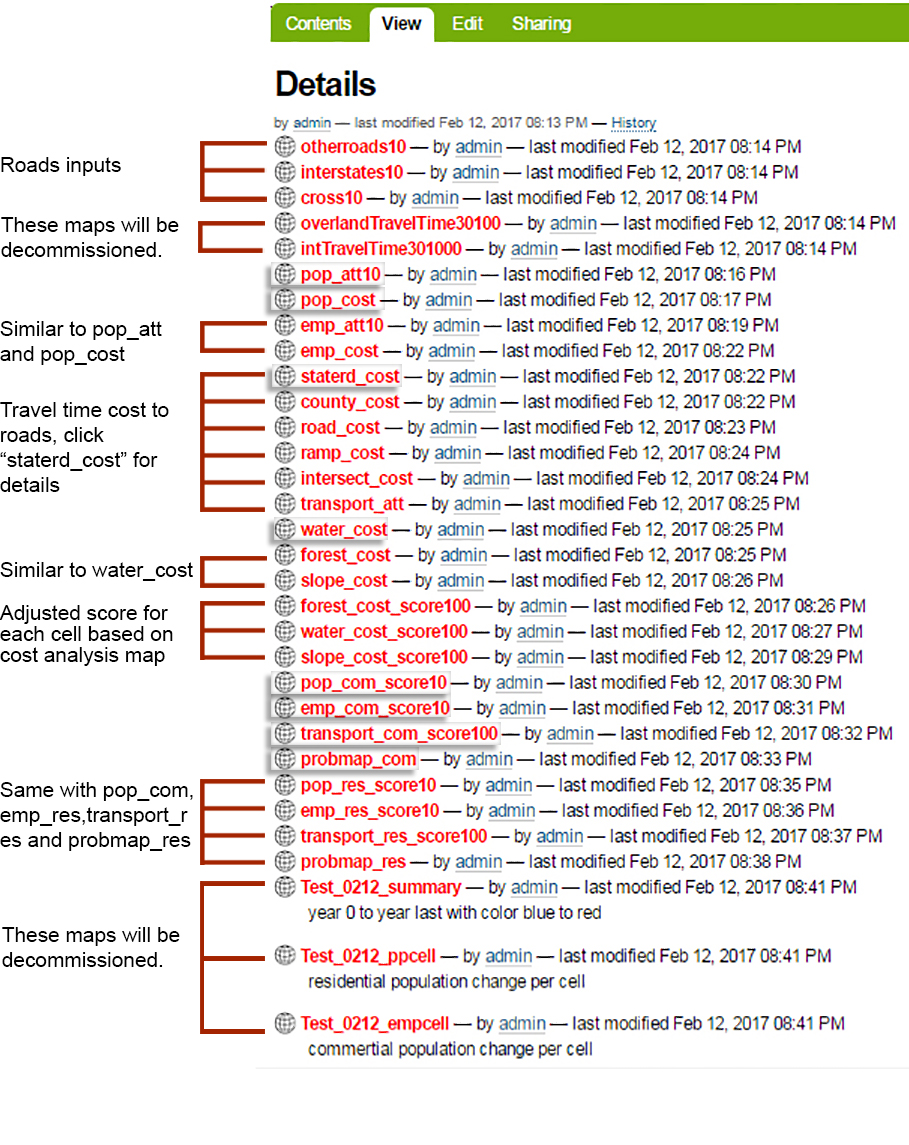
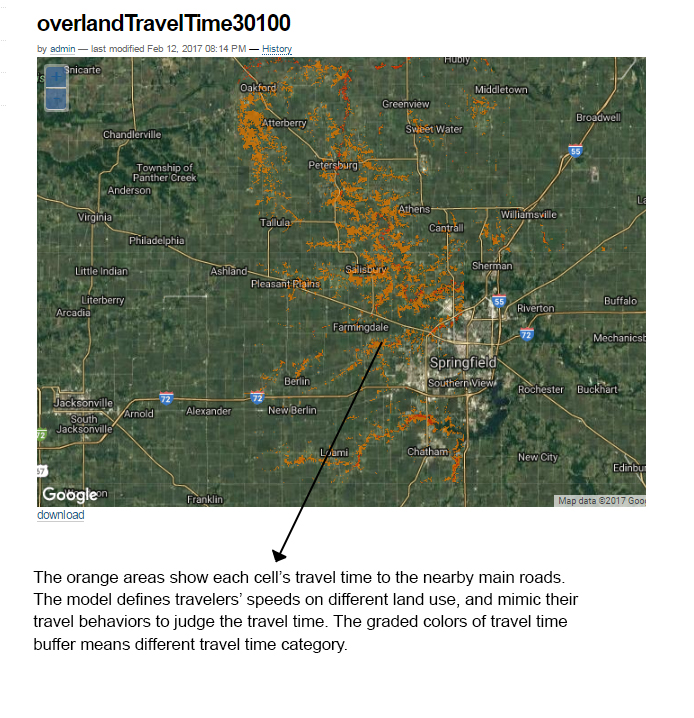
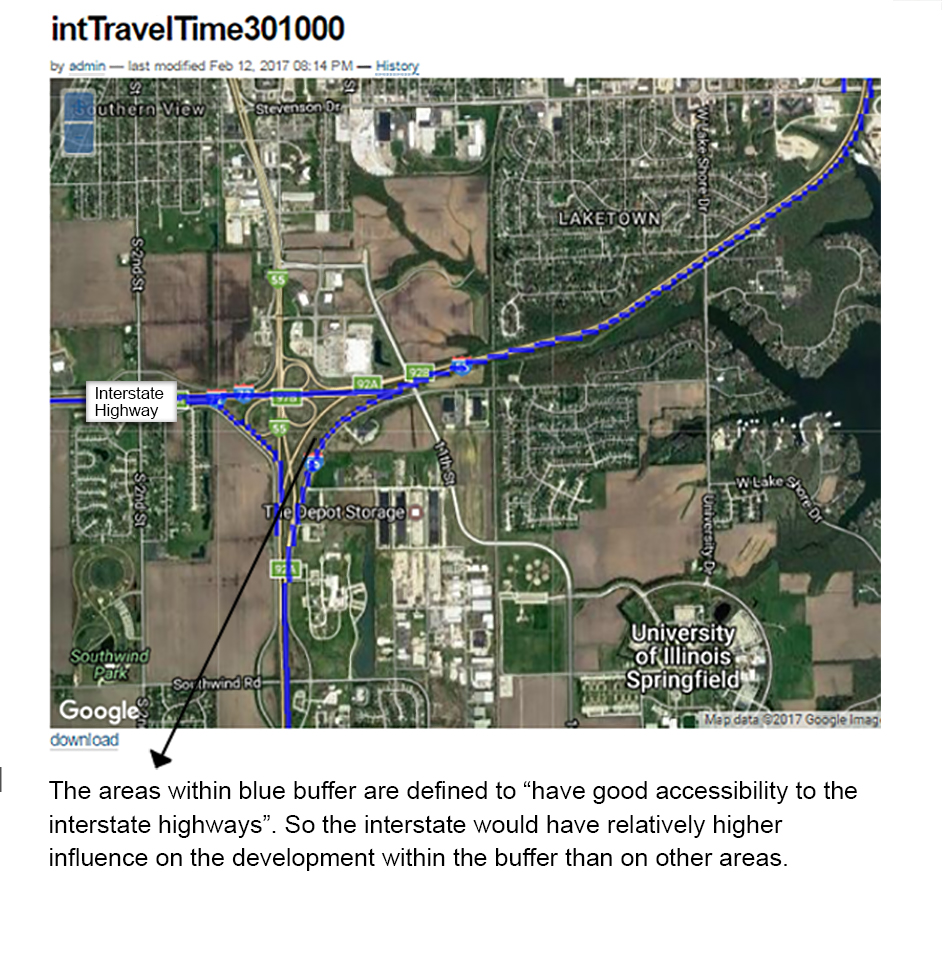
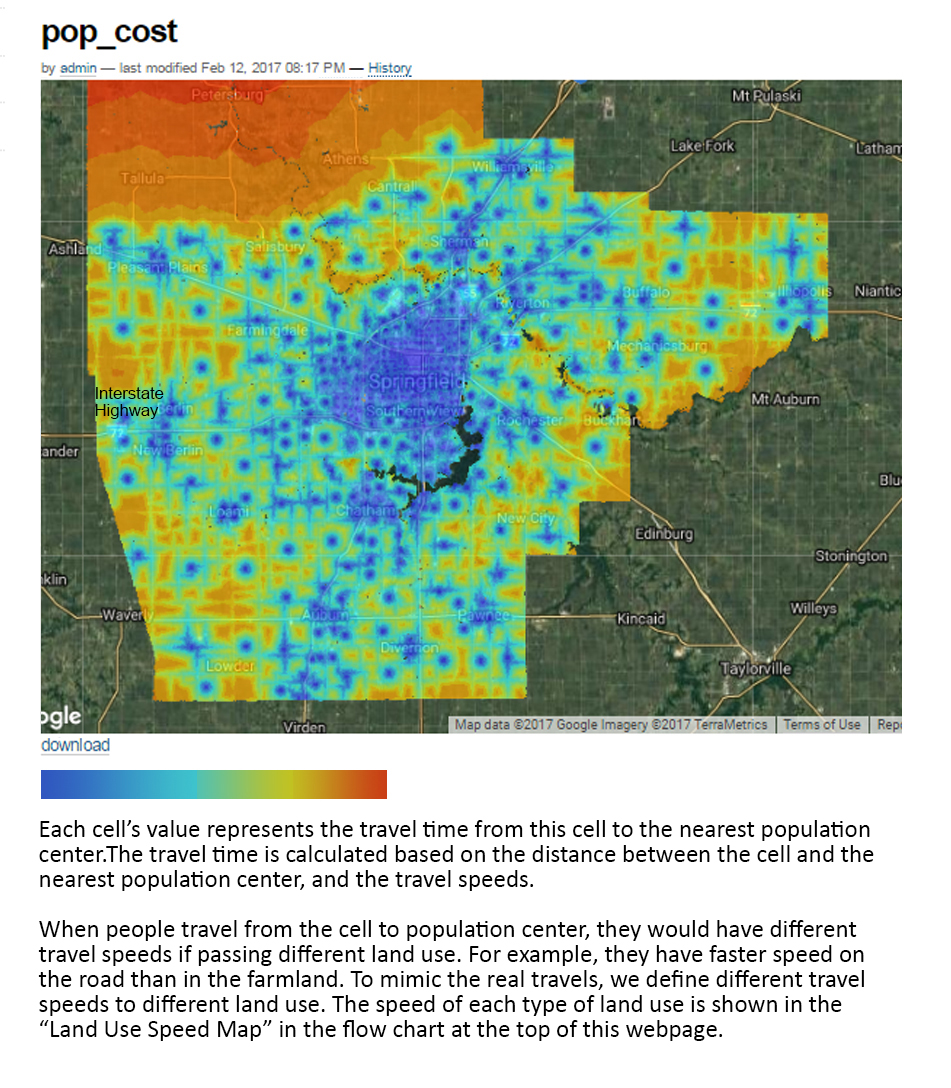
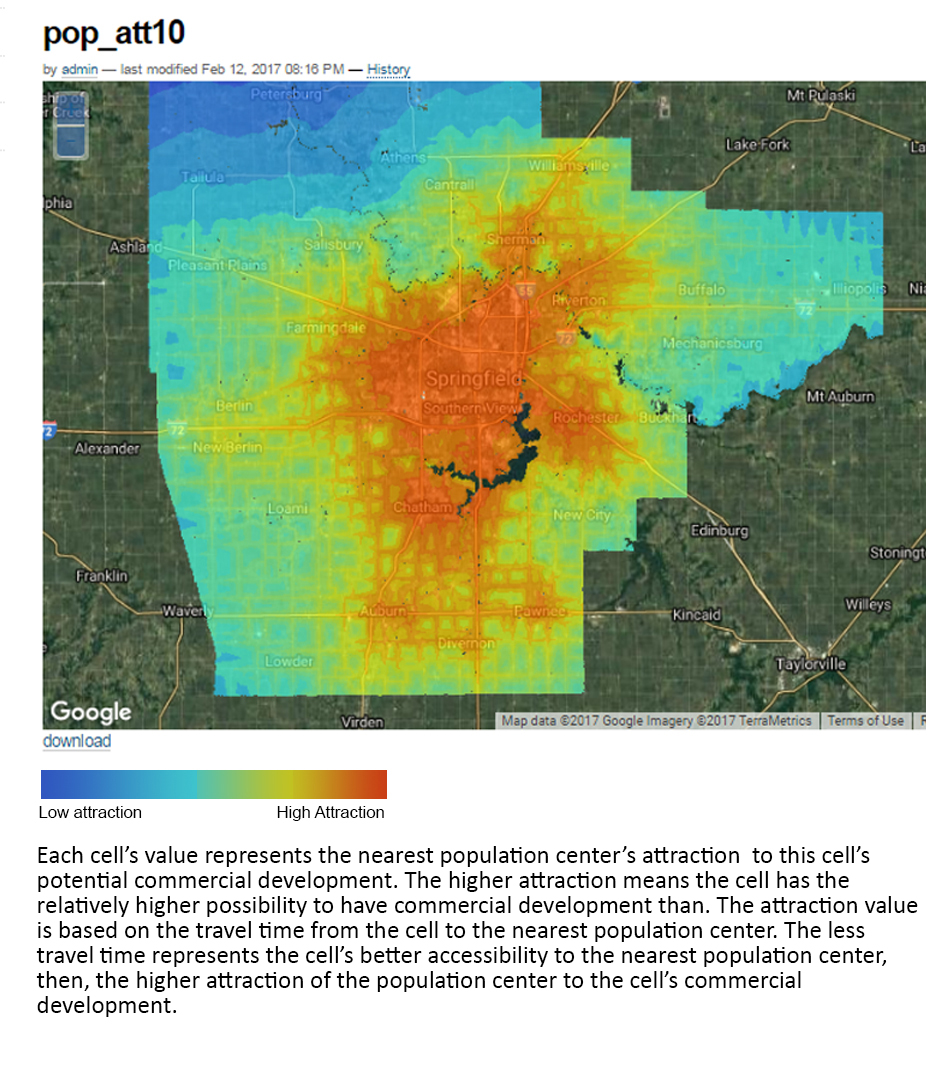
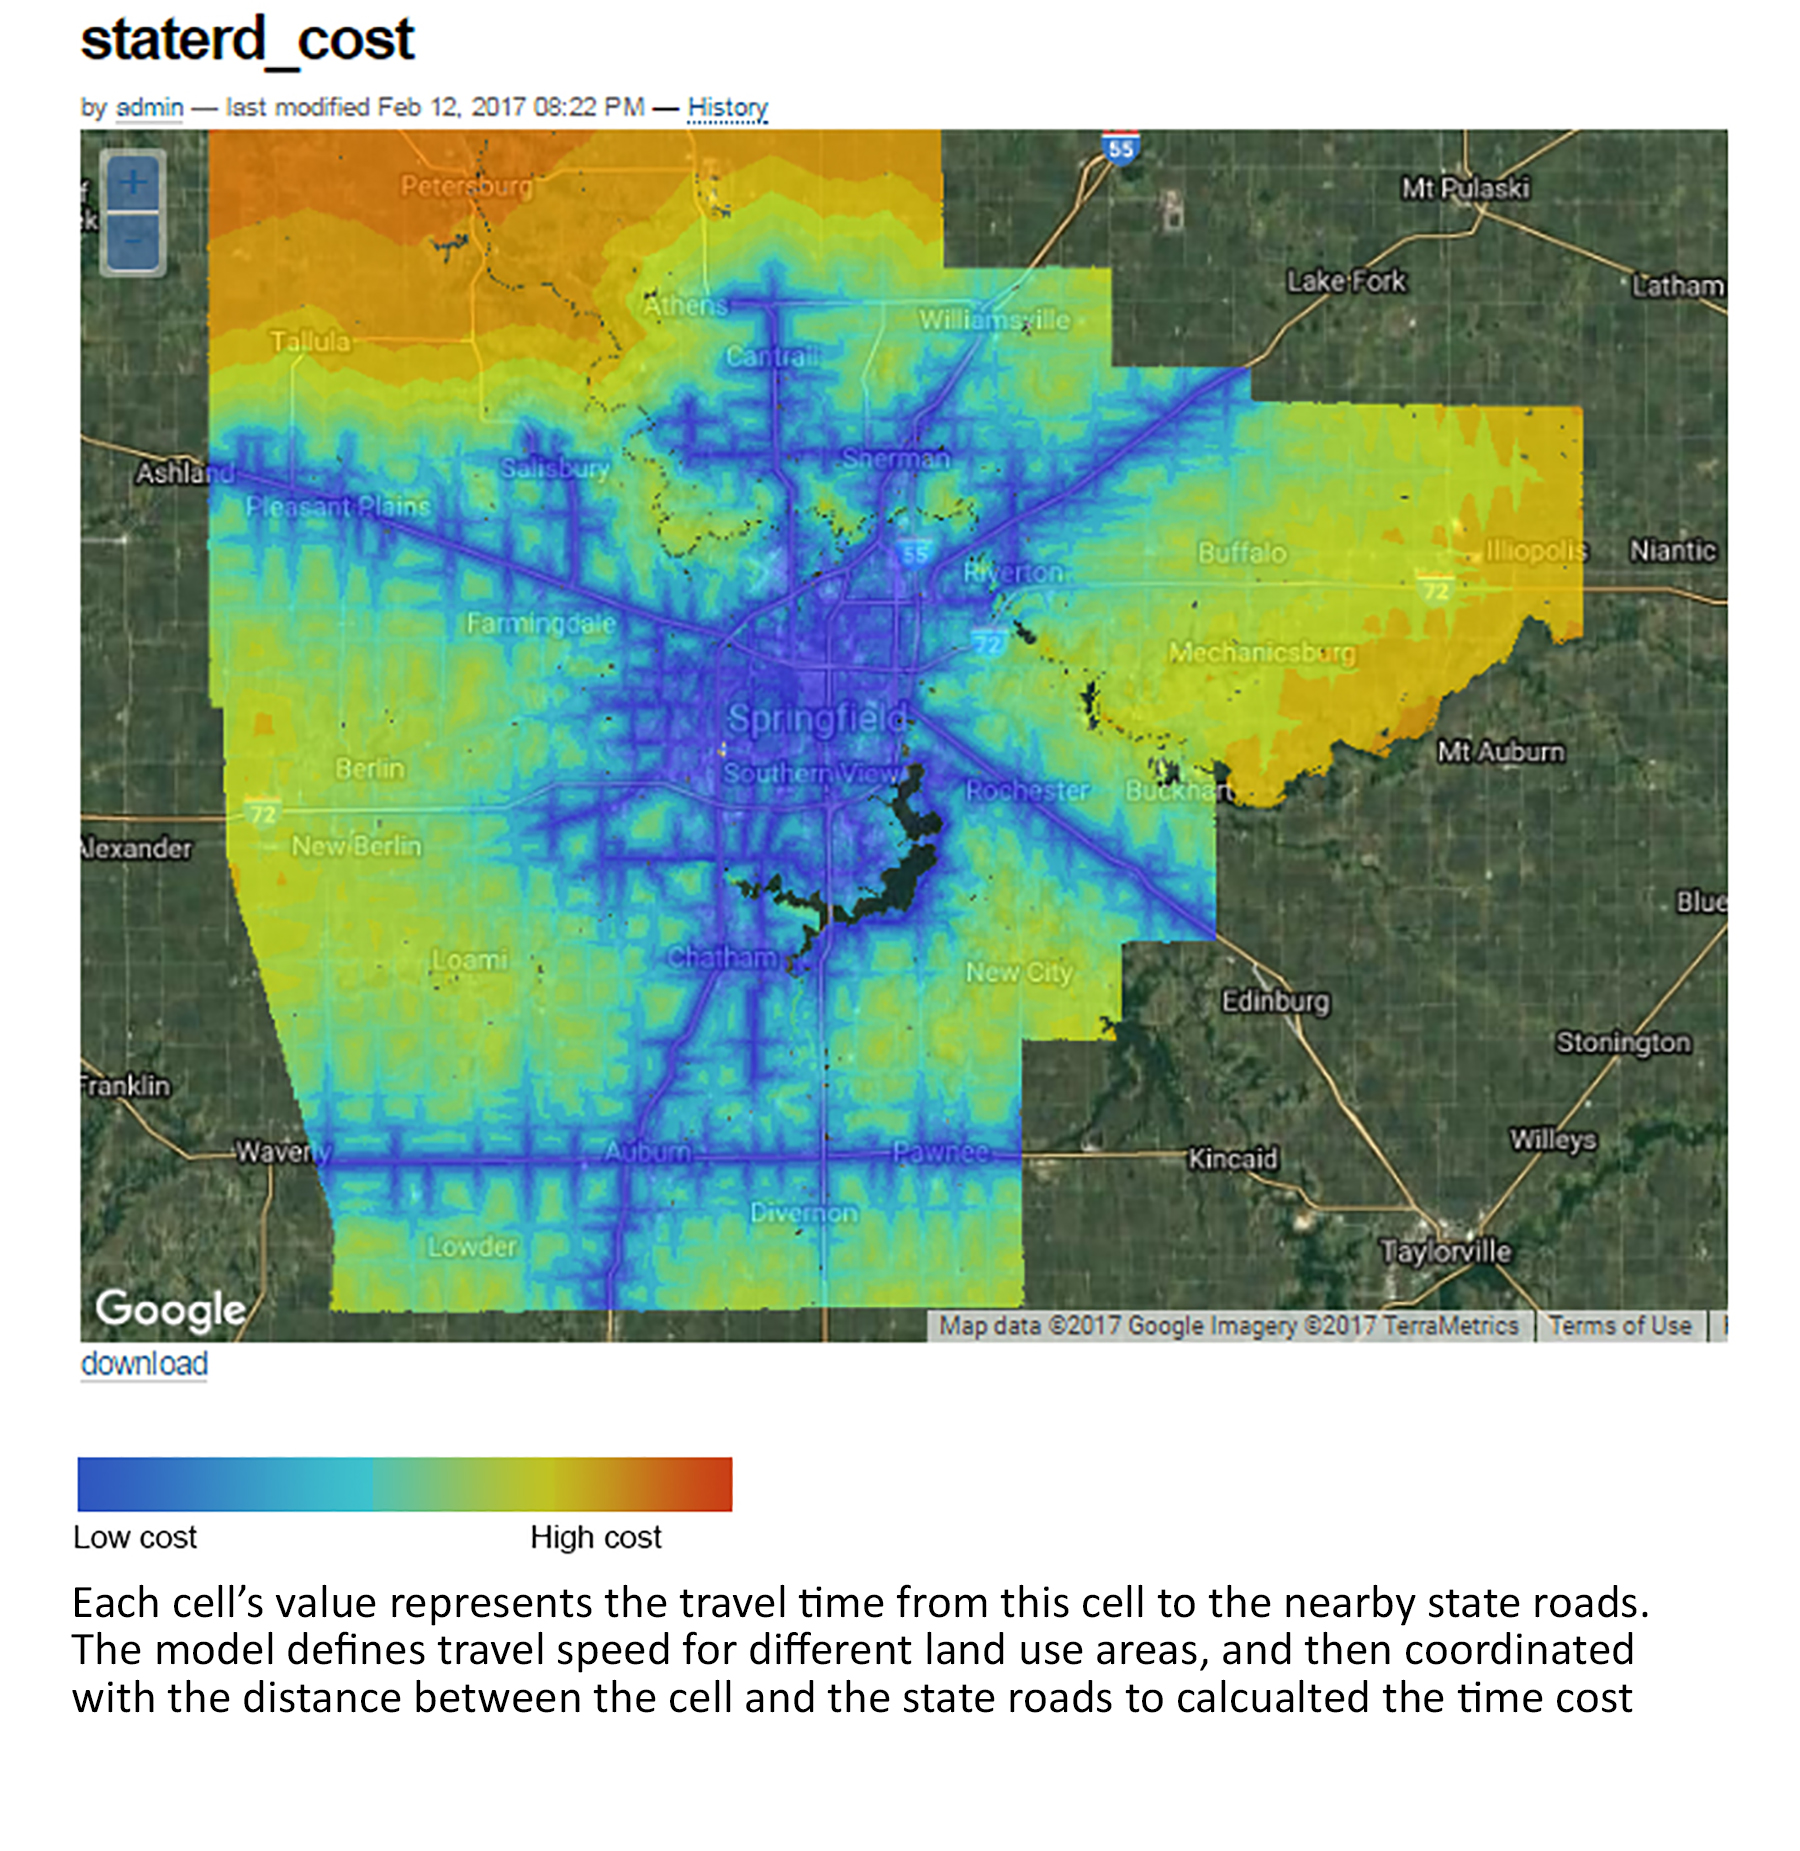
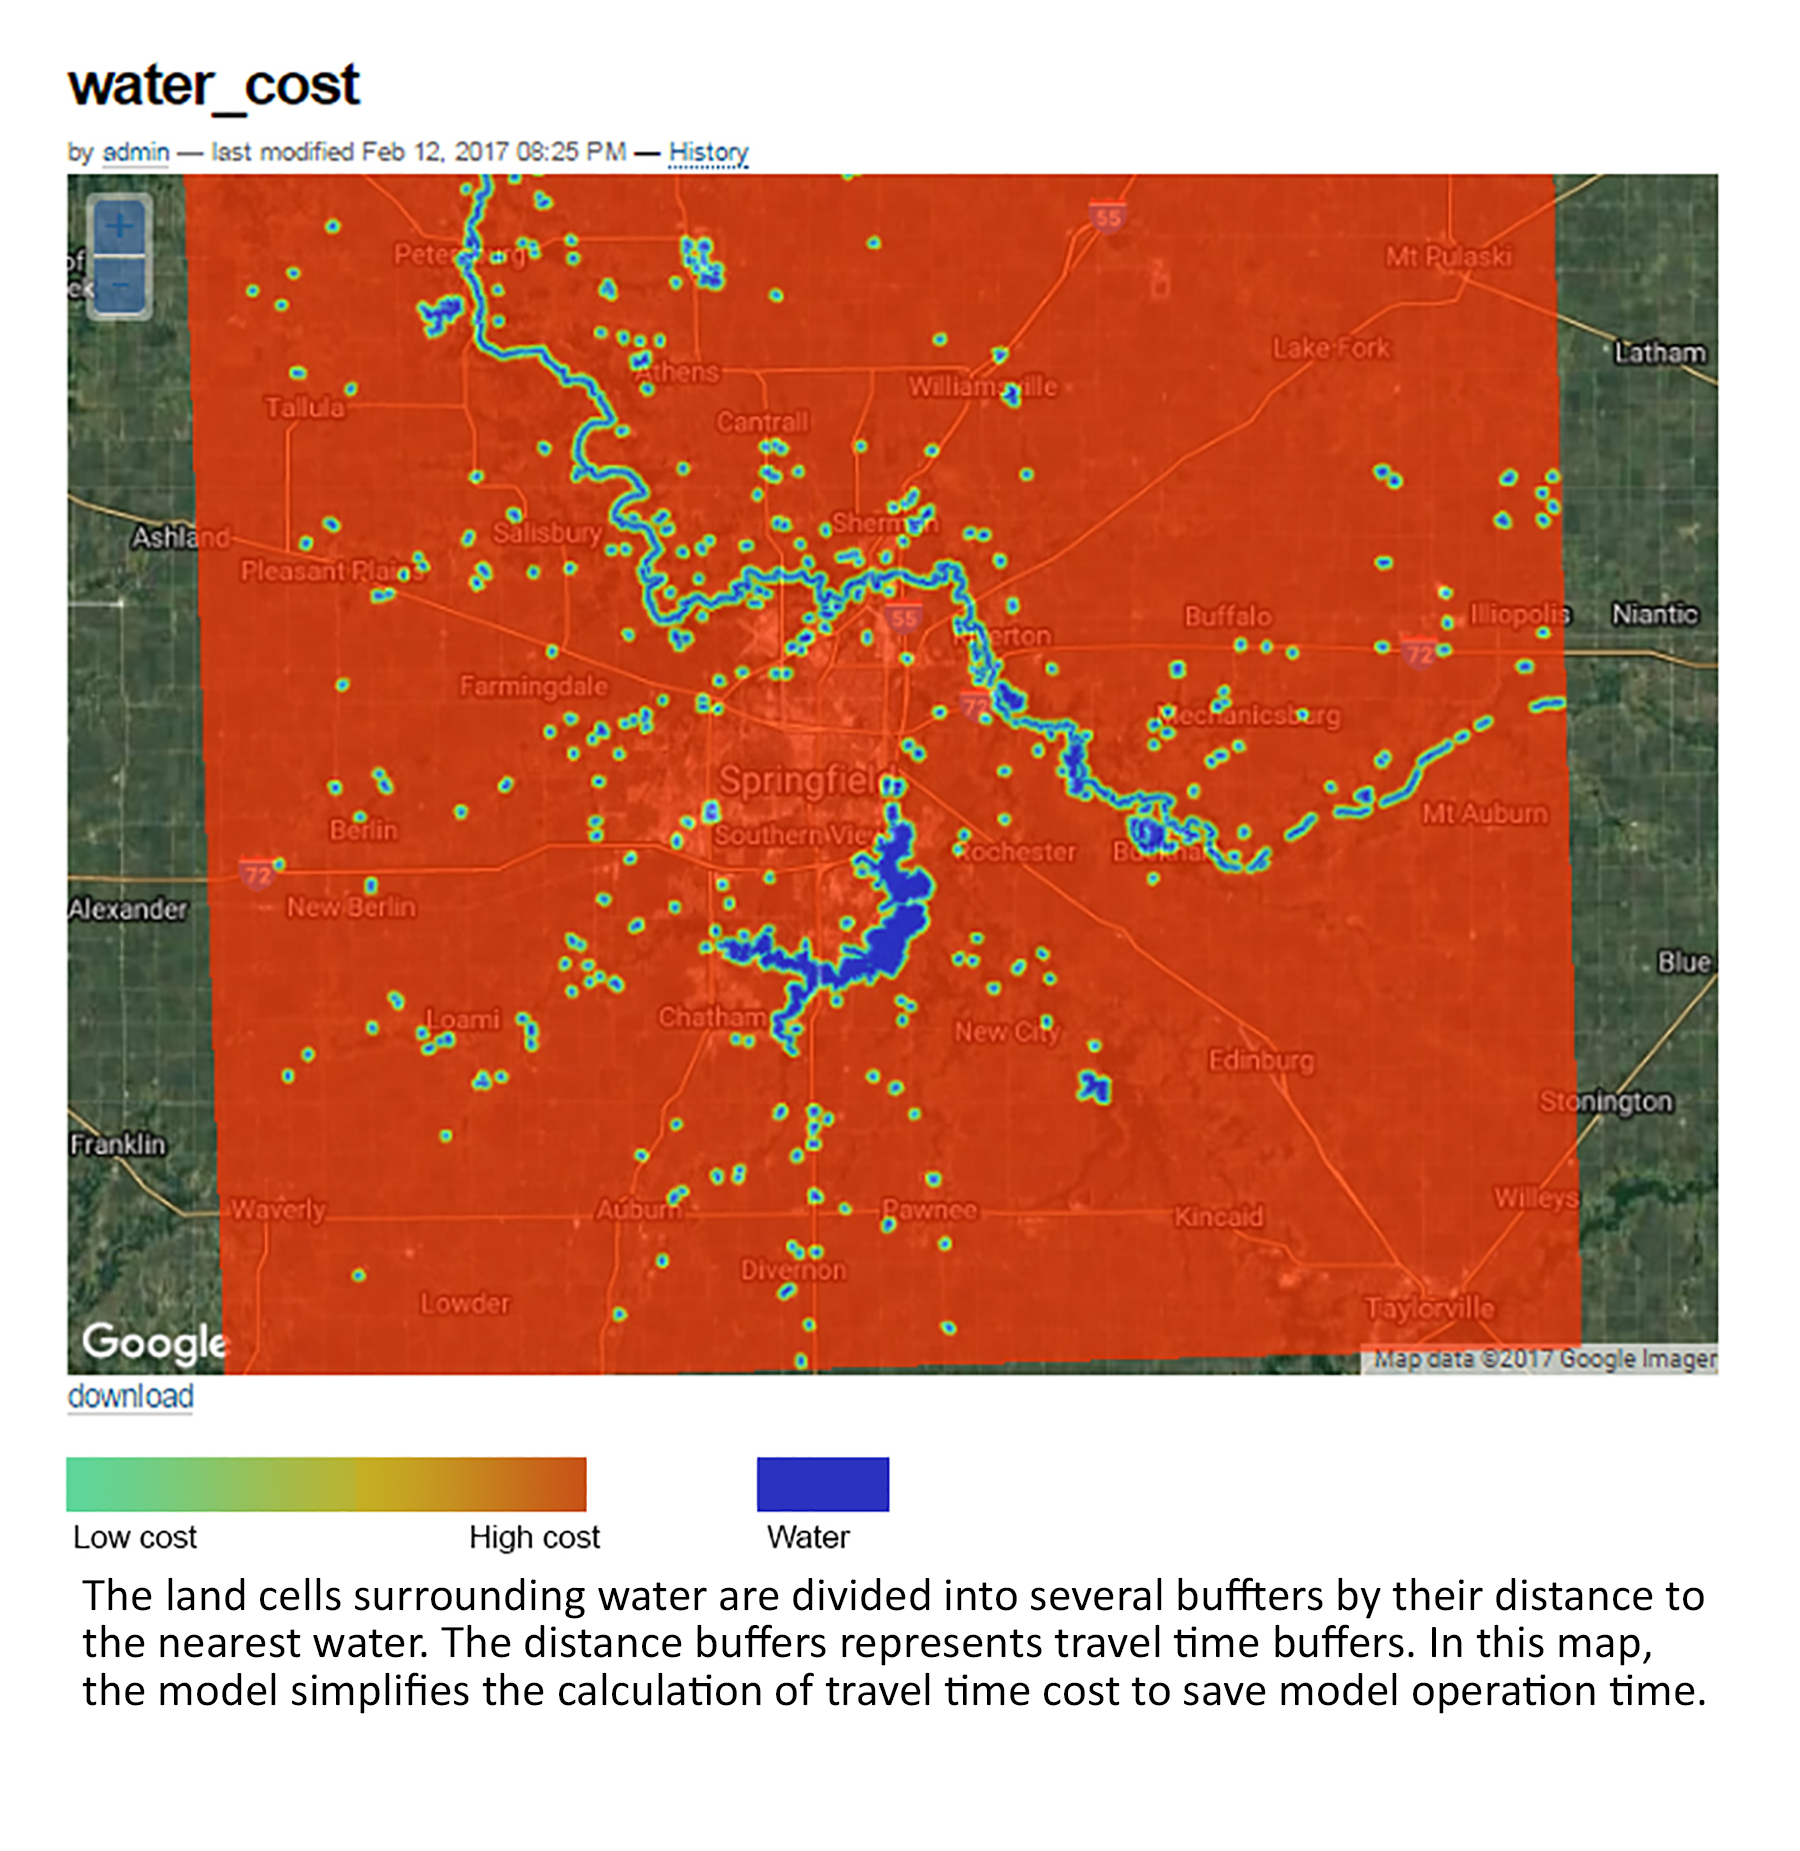
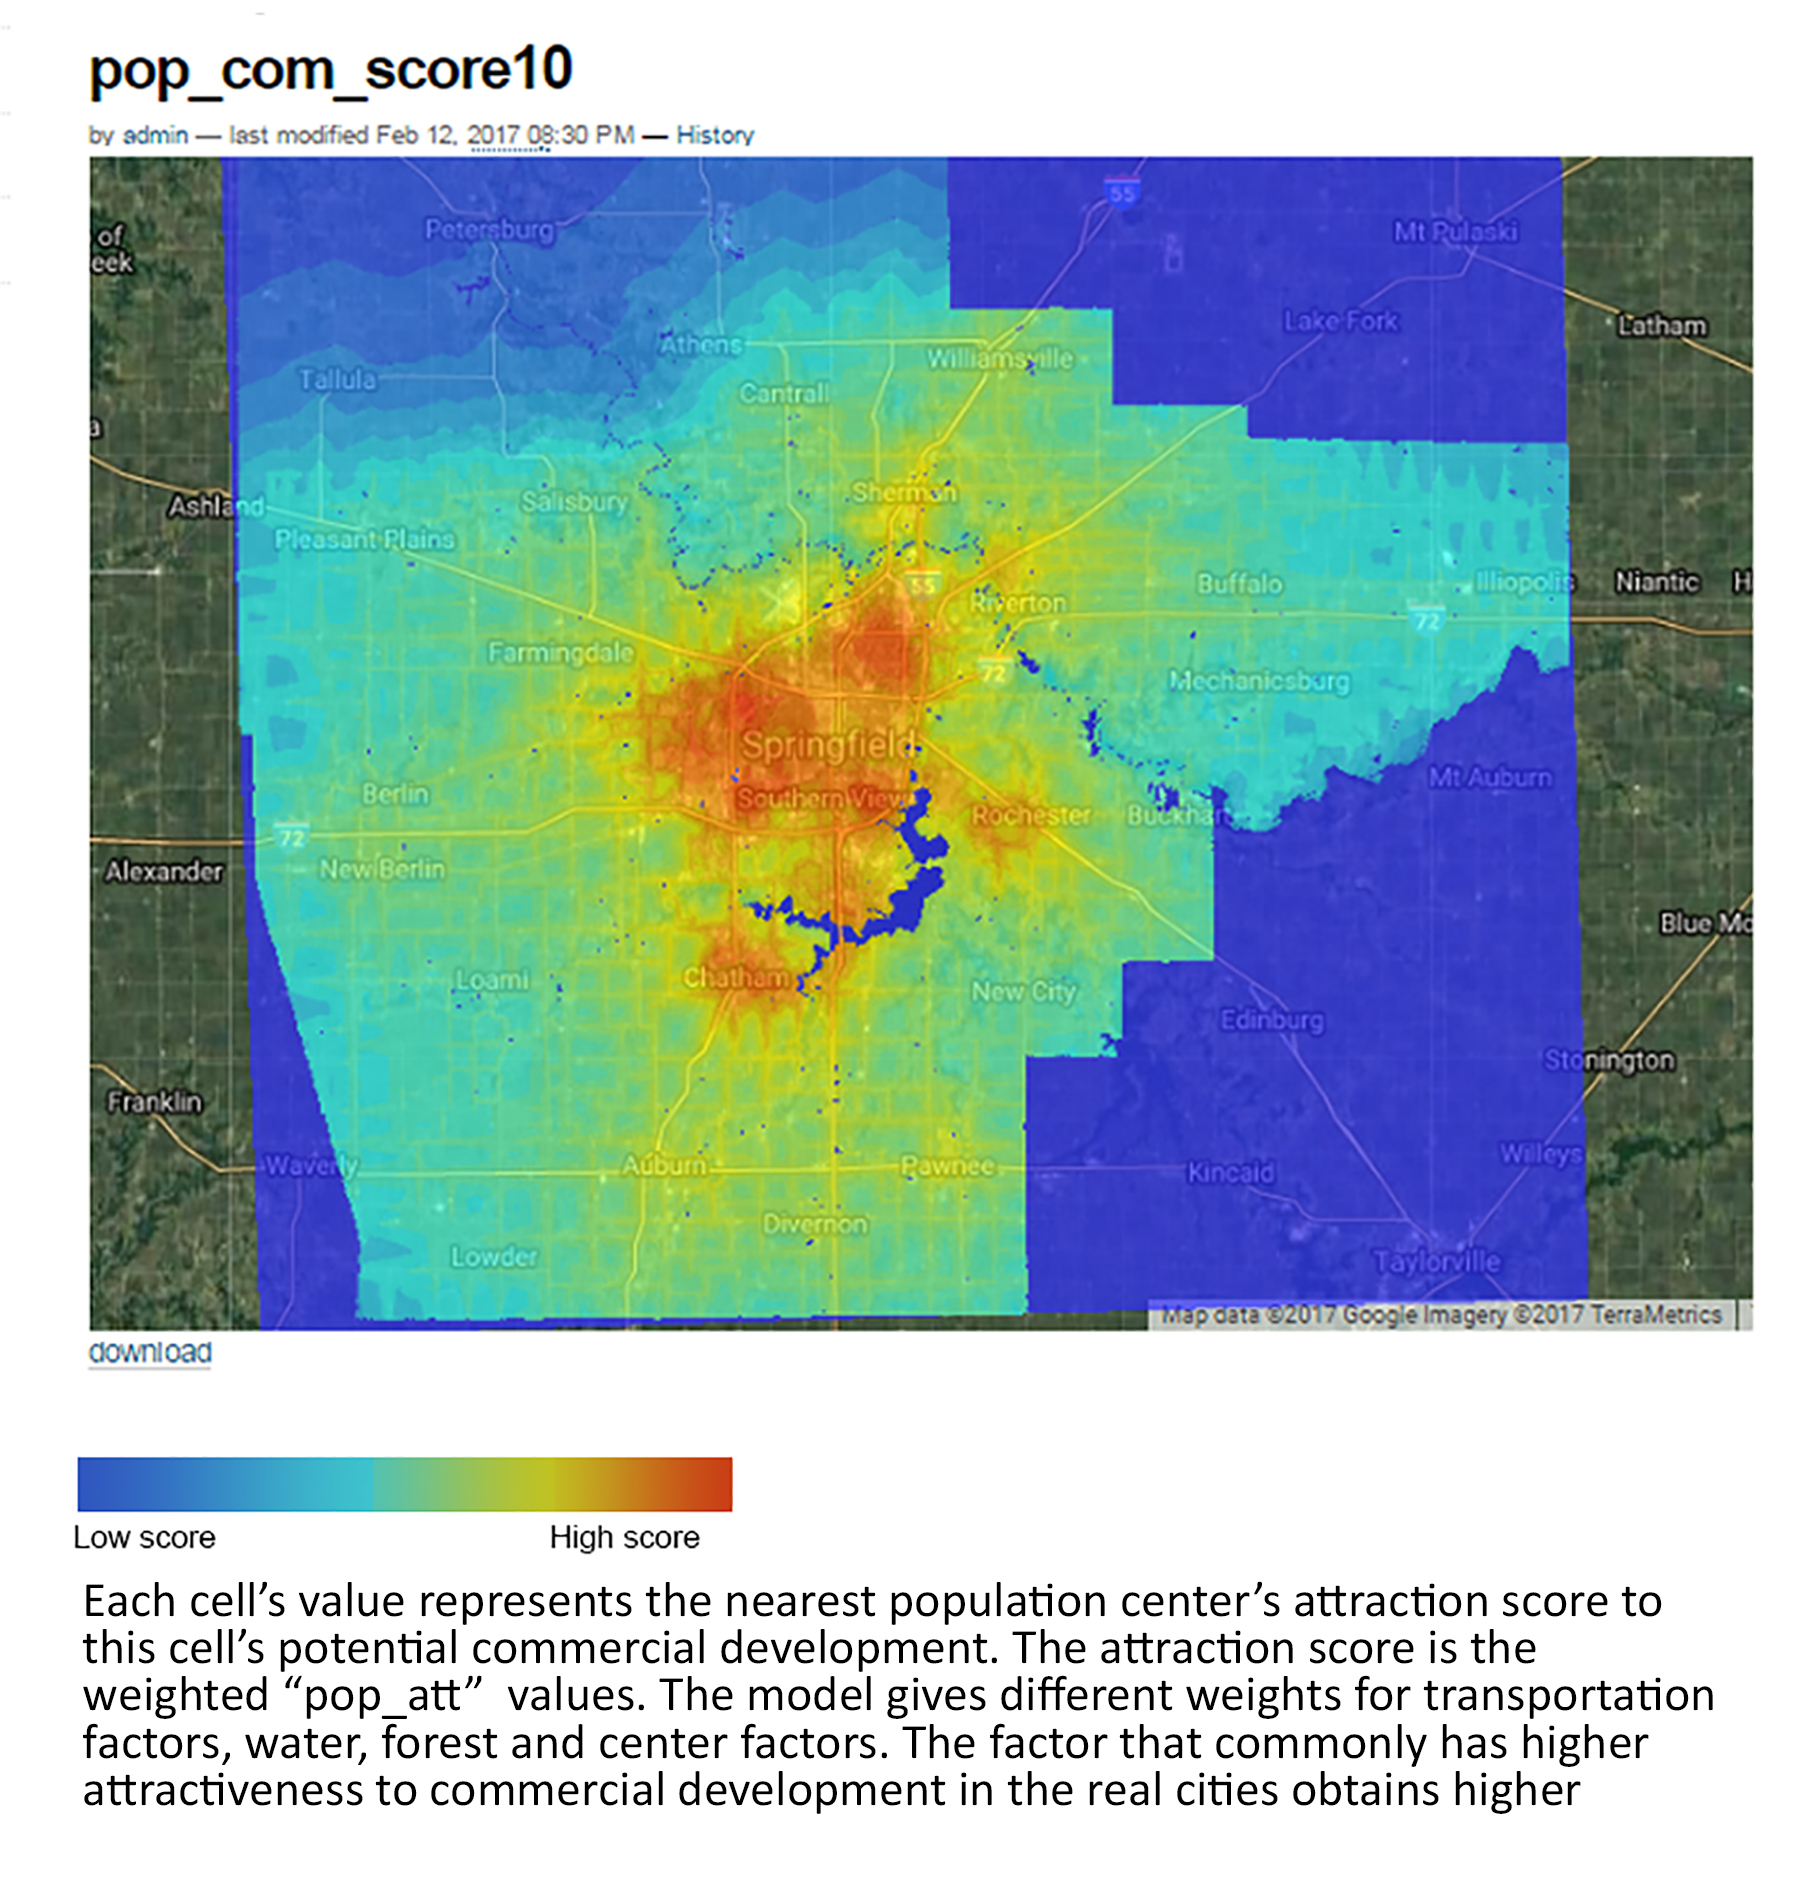
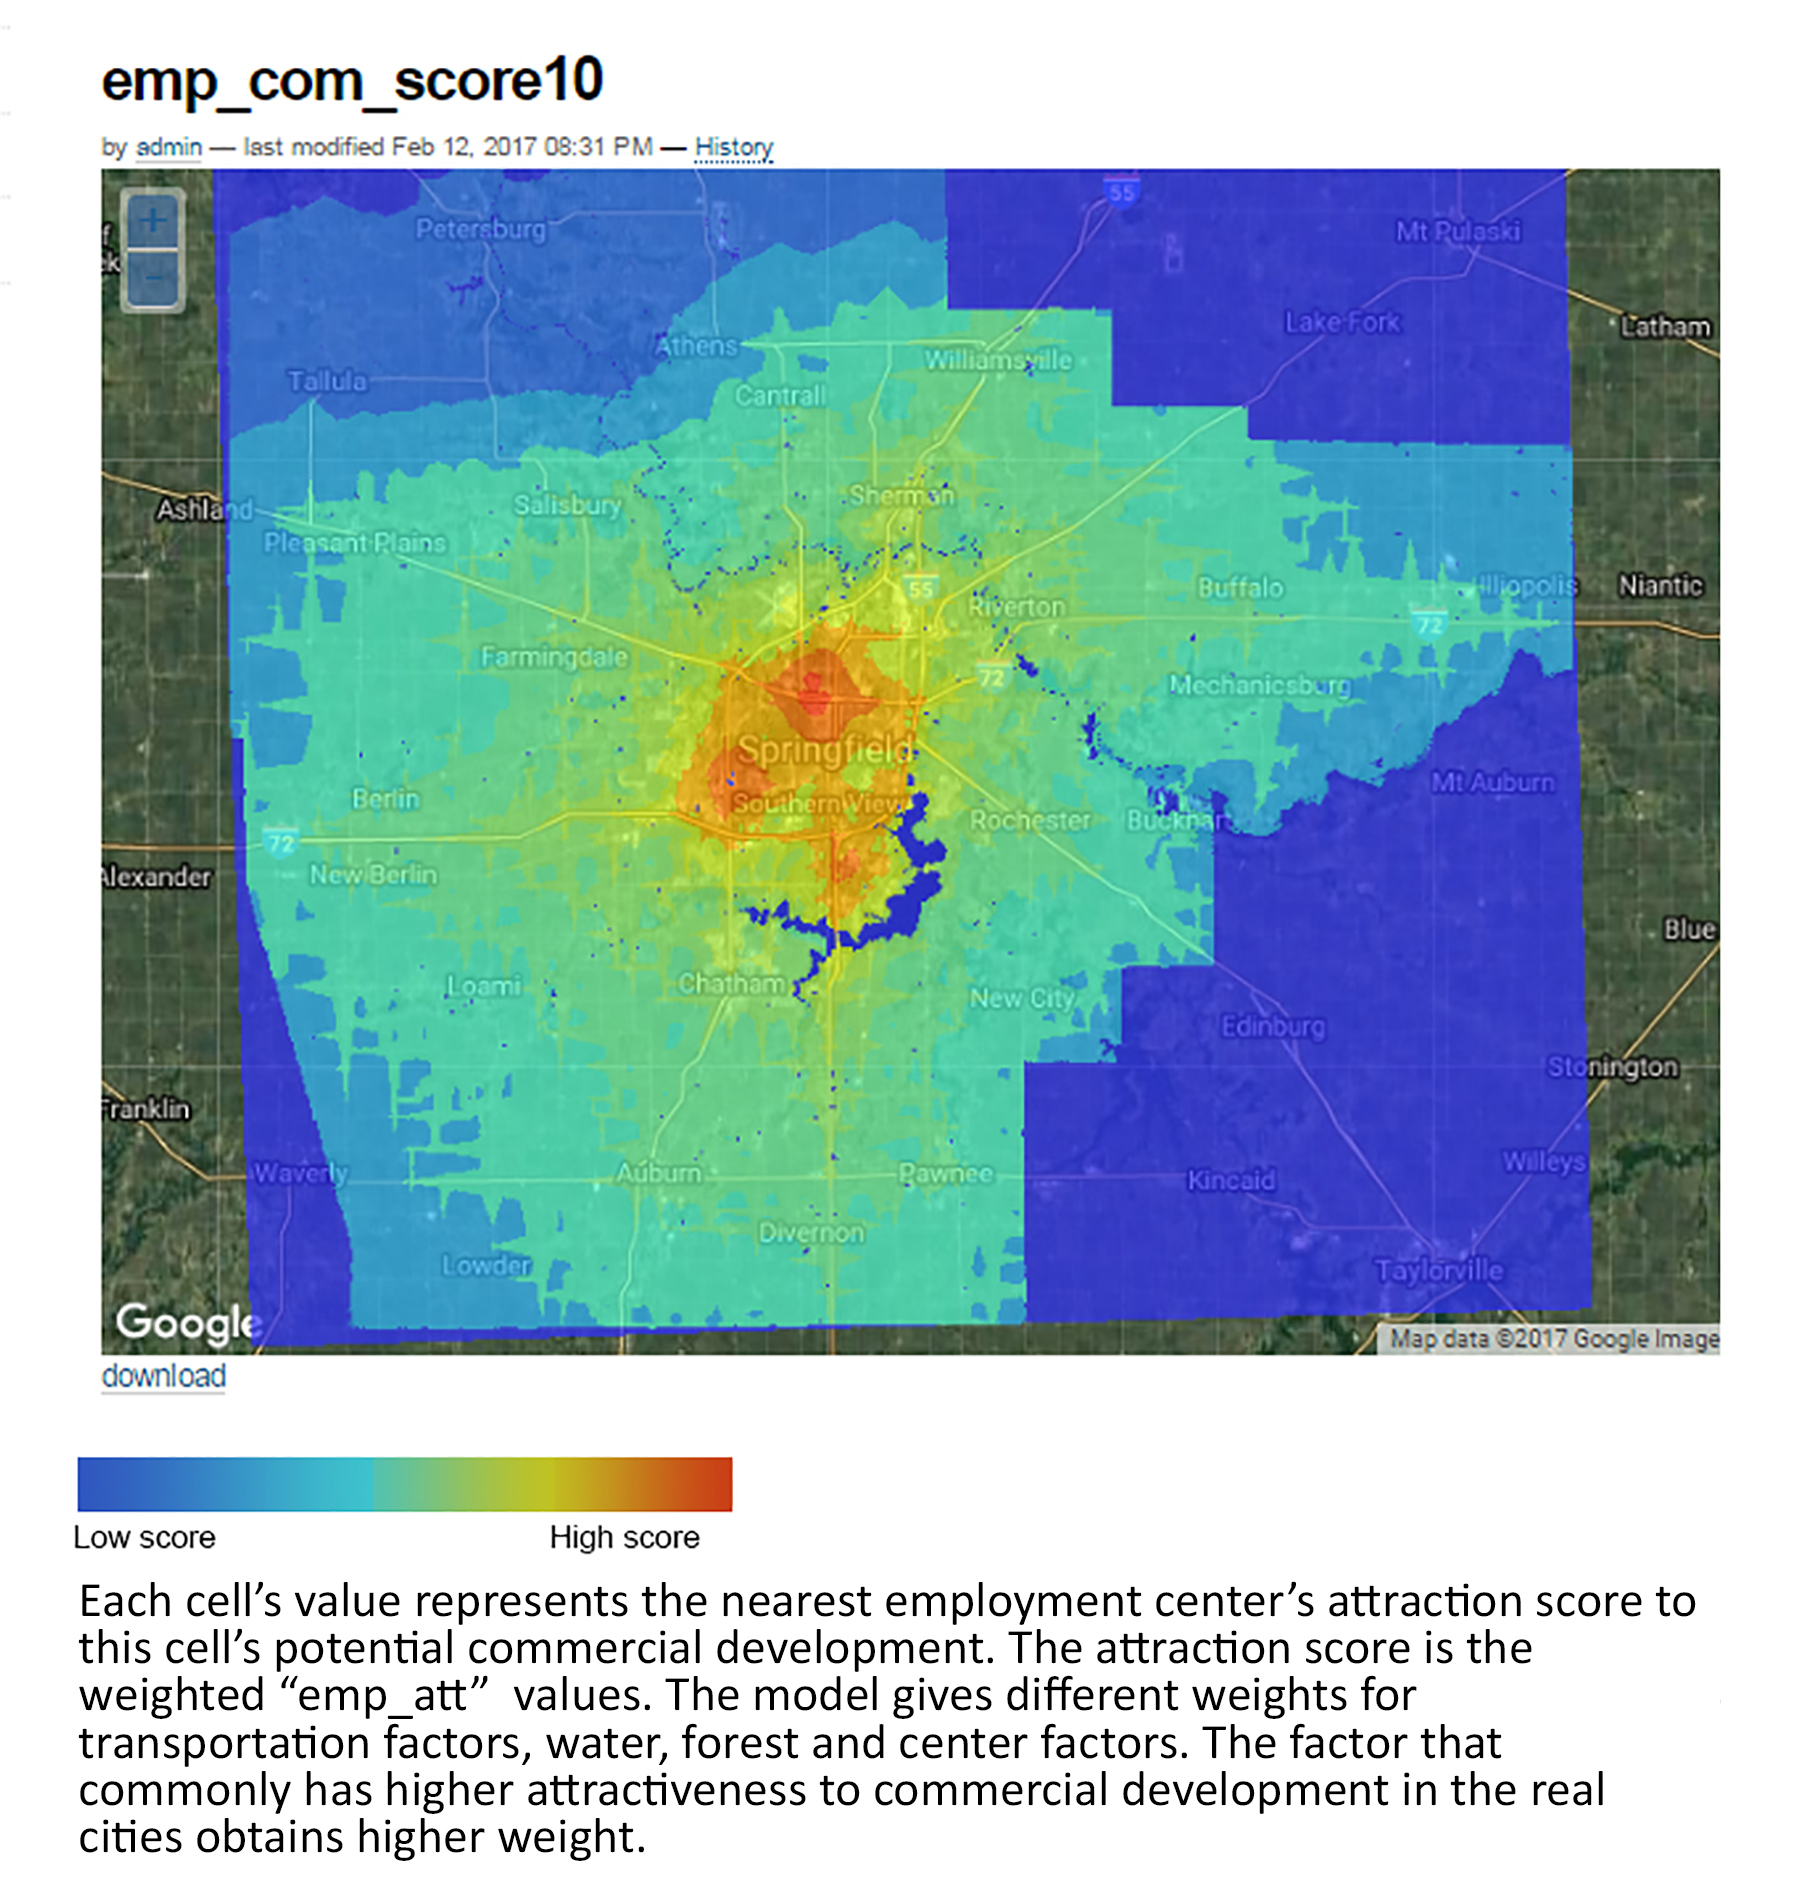
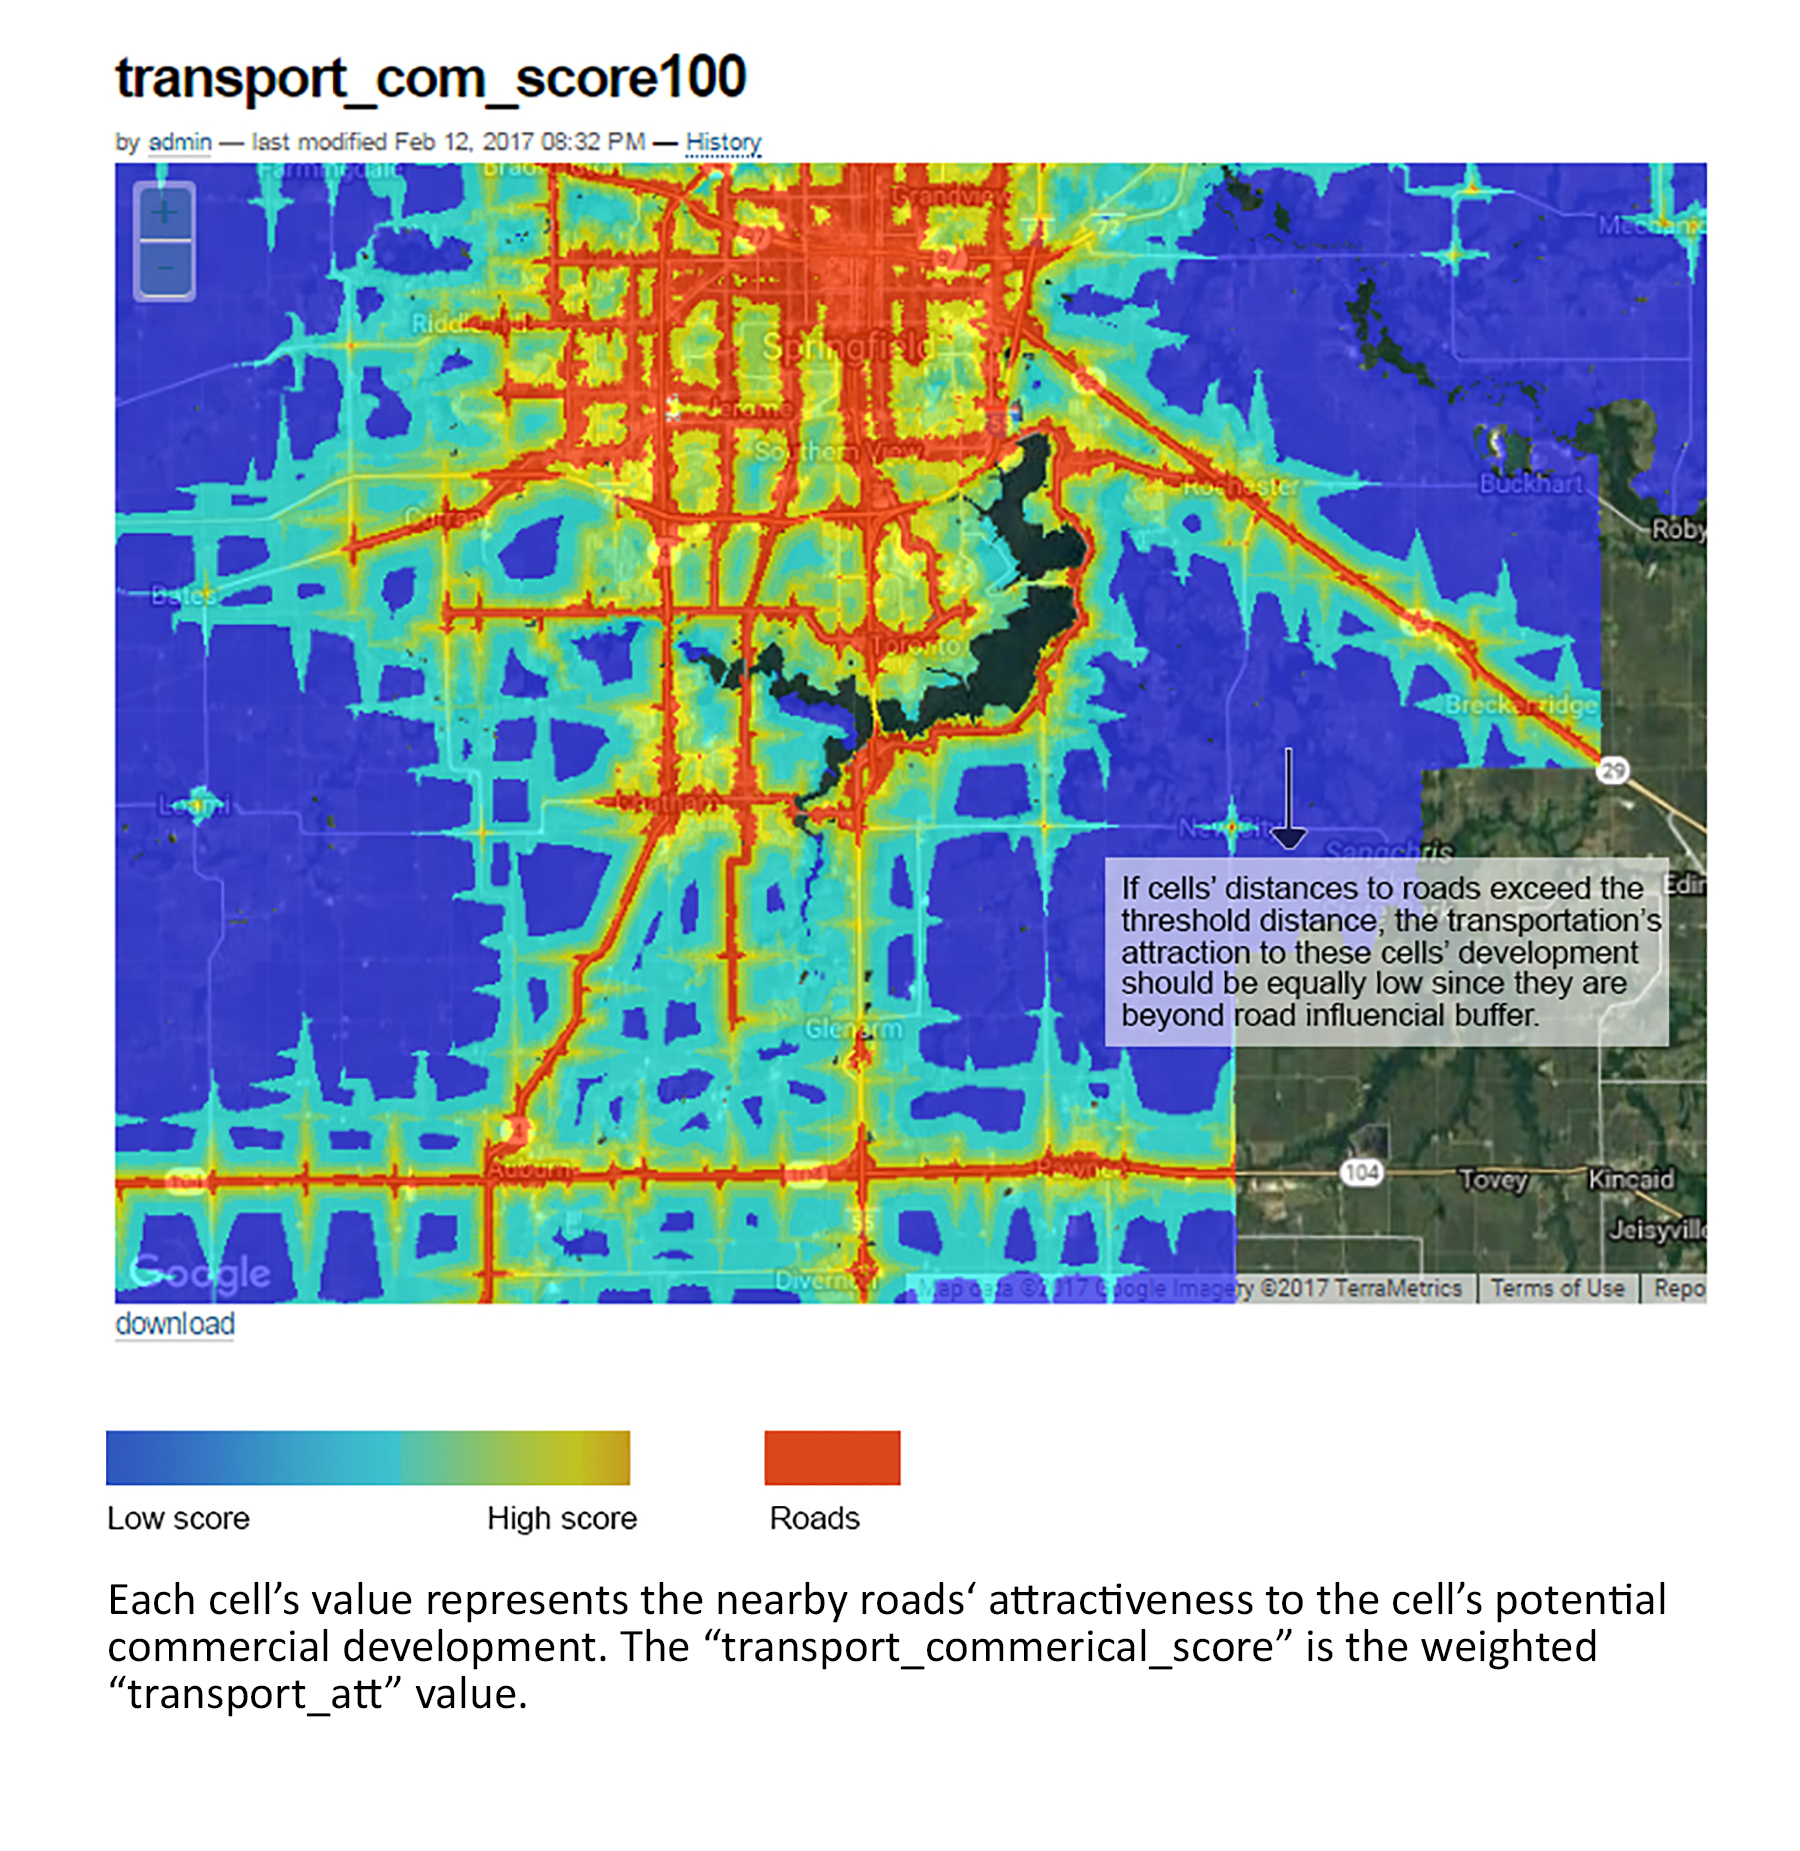
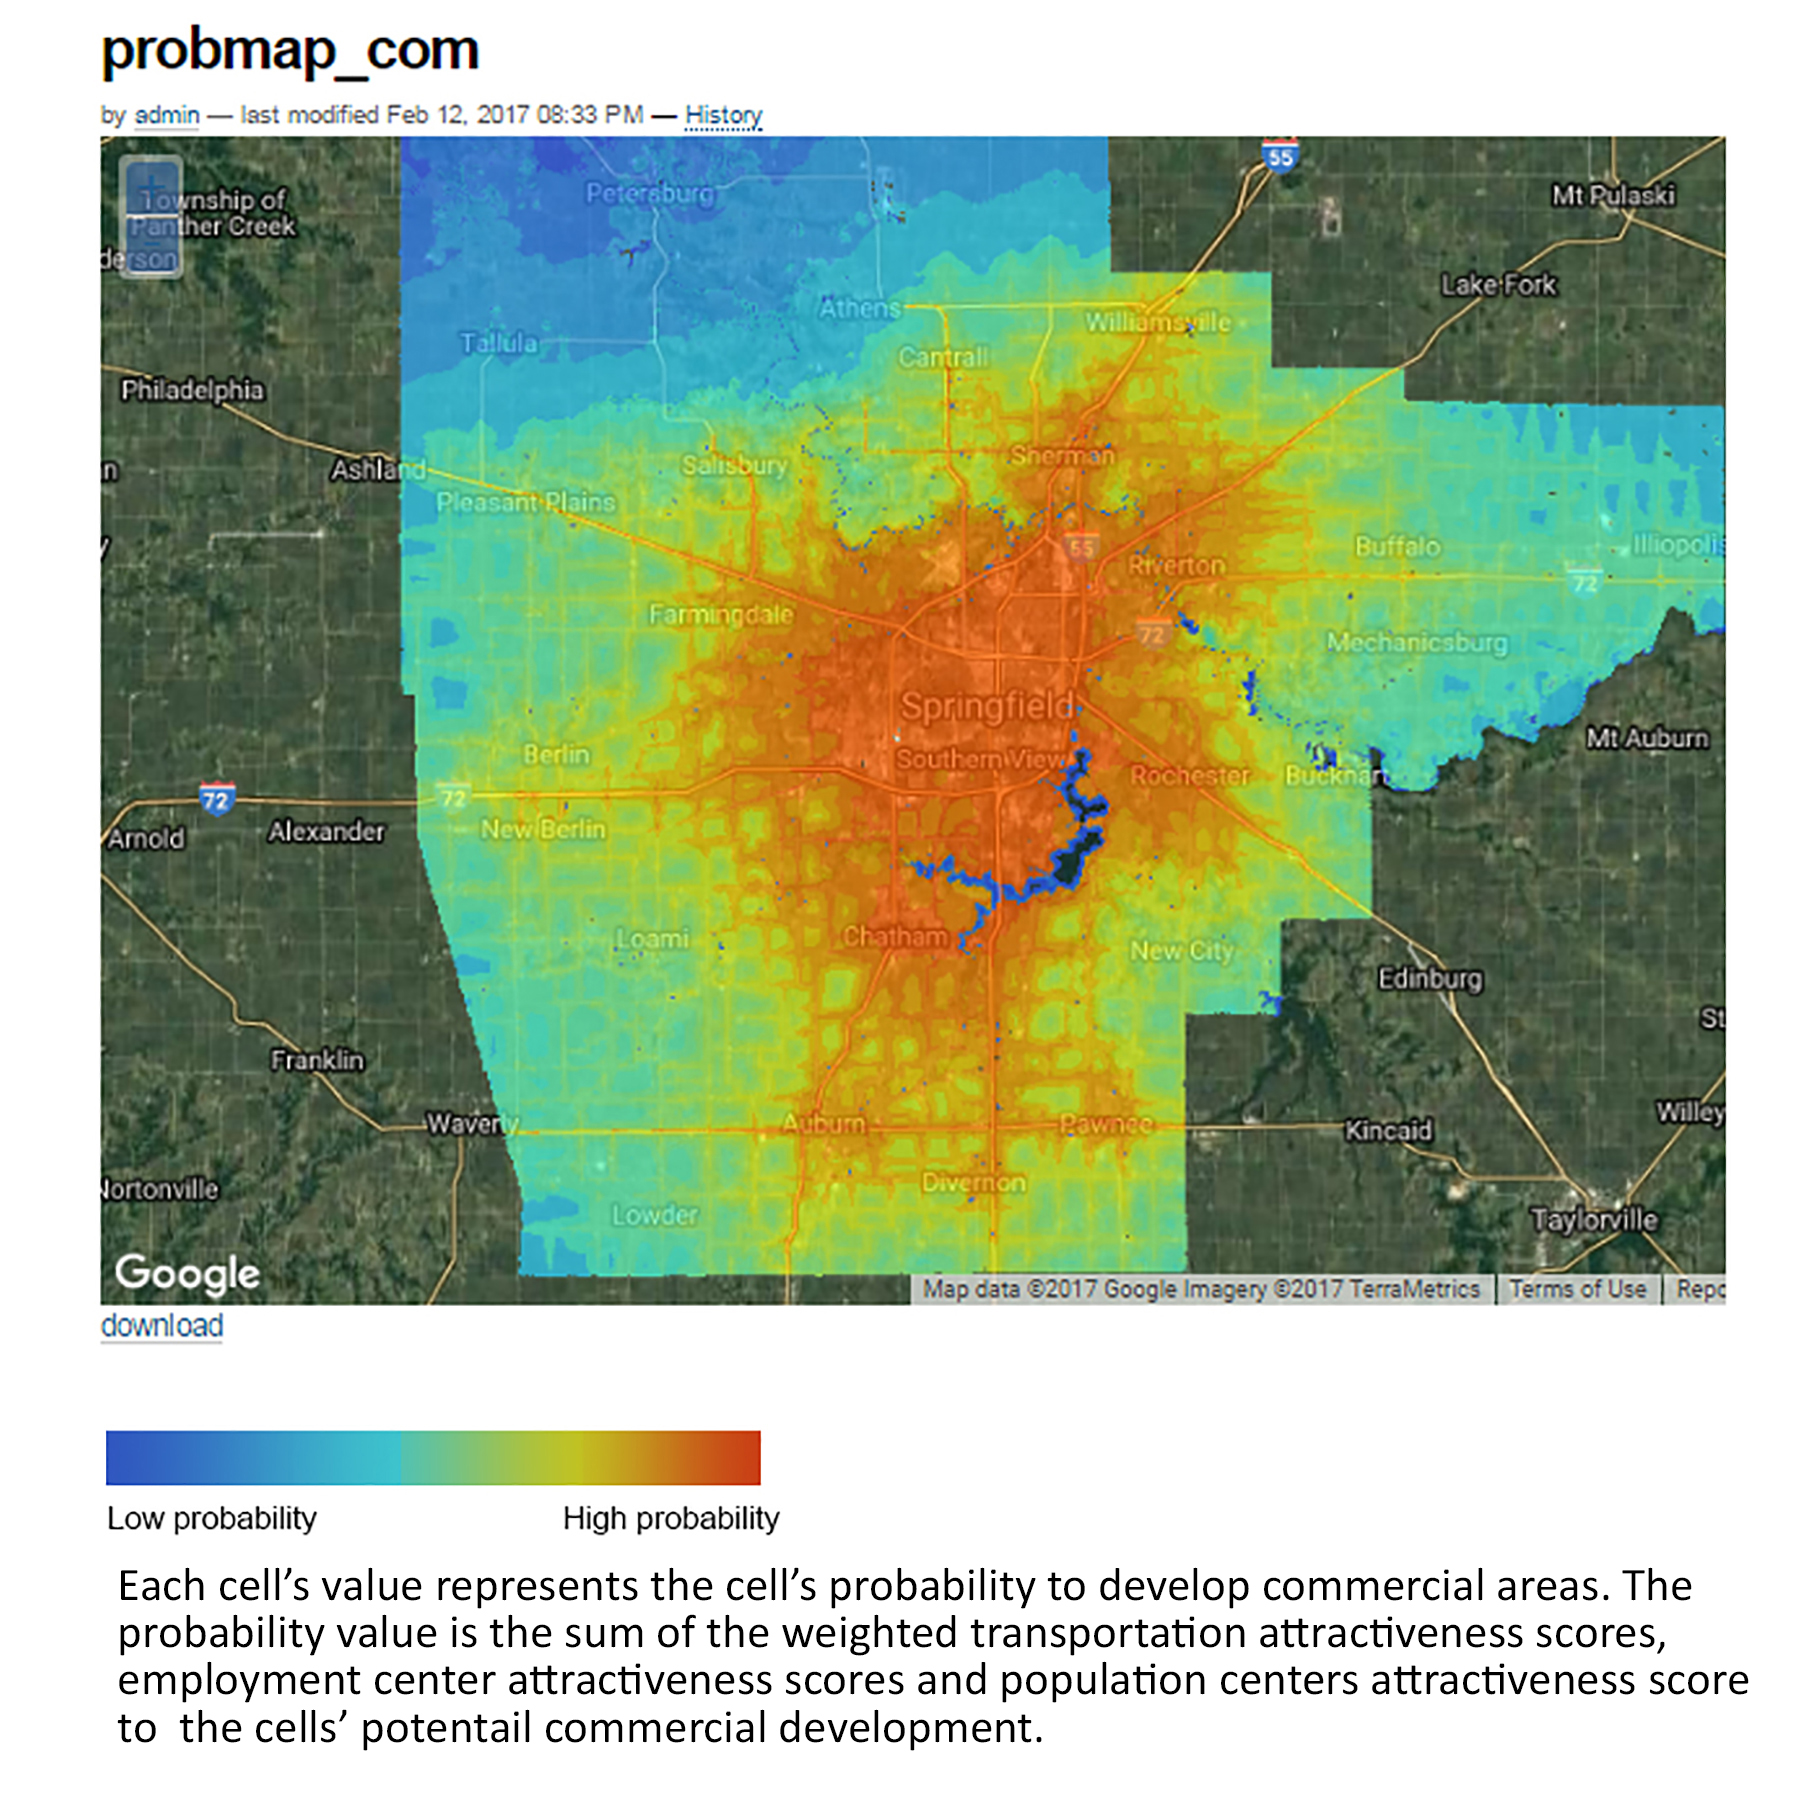
"DETAILS" FOLDER includes the intermediate maps that are created and used to establish the maps in the Results folder. Some of these maps are helpful for determining how to calibrate the model. These maps illustrate an areas' "cost" or "attractiveness" regarding transportation, land use and population. This can be thought of as "cost" being a subtraction and "attraction" an addition to the creation of the probability map.
Click on the raised map titles to see further explanations.
"RUNLOG" FOLDER reports the progress of a running model. You can check it to look at errors when a model fails.